EnerCom?s The Oil & Gas Conference Denver August 19, 2015 Siren Fisekci VP Investor & Corporate Relations
Syncrude joint venture structure Canadian Oil Sands 25% (COS) Suncor Sinopec 36.74% 12% Nexen (CNOOC) 7.23% Murphy Oil Mocal (JX Nippon) 5% Imperial Oil ExxonMobil and Imperial provide global best practices, proprietary…
Syncrude: a high quality asset ? Established production base ? Fully upgraded light, sweet crude oil ? Proven operator and proven technology ? Predictable reservoir recovery ? over 90% ? Non-declining production profile ? 40+ year…
Syncrude: a leader in responsible development Environmental stewardship ? Reclaimed 3,400 hectares of land, with another 1,100 hectares ready for revegetation ? In 2015, won an award for wetland reclamation - Sandhill Fen Watershed…
Reducing operating costs 2015 Outlook 1 2014 Actual $49/barrel $40/barrel $9 1. Per 2015 Outlook as at July 30/15
Focused on operational performance Bitumen Production Rebuild, redesign and expand mine trains Retrofit, reconfigure and debottleneck bitumen froth treatment R Upgrading Modifications to Flue Gas Desulphurizer Improvements to CO…
Major Projects successfully completed On Time Under Budget Under Budget ($millions) Aurora Mine Train Relocation R R $200 Aurora Tailings Management R R $50 Mildred Lake Mine Train Replacement R R $400 Centrifuge Tailings…
0 200 400 600 800 1000 1200 1400 2011 2012 2013 2014 2015F Major Projects Regular Maintenance Significantly lower capex requirements $ millions, net to Canadian Oil Sands 1,2 1. Capital costs only; excludes capitalized…
Cost to produce Syncrude?s fully upgraded oil Break-even cost based on 2015 Outlook(1,2) CAD $/barrel (approximate) Operating expenses 40 Regular maintenance capital expenditures 3 8 Crown royalties 5 Development expenses &…
Strong liquidity position ? Net debt1 is $2.4 billion at June 30 ? Long-term debt-to-total capitalization1 at 37% ? No long-term bond payments until 2019 ? Credit facilities totalling $1.5 billion, extended to 2019 ? Recent dividend…
Dividends reflect free cash flow over time (1,2) 1. Includes distributions on trust units prior to Dec. 31/10 2. Free cash flow (FCF) is cash flow from operations less capital expenditures and is a non-GAAP measure 3. 2015 Dividend and…
High value Syncrude barrel WTI Bakken Syncrude SCO Value (as % of crude price) 2 29 37 8 25 3 28 37 6 26 2 16 48 33 65% 100% 115+% 110% 65-70% Based on analysis provided to COS by Muse Stancil; crude oil fractions shown…
Kitimat Hardisty Edmonton Burnaby Cushing Montreal Houston Sarnia Patoka Quebec City Markets for COS? Syncrude production Chicago Syncrude Current synthetic crude oil markets Potential new markets
Global oil demand vs. production (excluding US tight oil) 75.0 77.0 79.0 81.0 83.0 85.0 87.0 89.0 91.0 93.0 95.0 75.0 77.0 79.0 81.0 83.0 85.0 87.0 89.0 91.0 93.0 95.0 Mm Bbls/Day Global Oil Production* Without…
COS share price correlated to oil price Source: Bloomberg 0 50 100 150 200 250 300 350 2006 2007 2008 2009 2010 2011 2012 2013 2014 2015 COS WTI
COS share price correlated to oil price Source: Bloomberg 0 50 100 150 200 250 300 350 2006 2007 2008 2009 2010 2011 2012 2013 2014 2015 COS WTI
COS offers compelling valuation $0 $20,000 $40,000 $60,000 $80,000 $100,000 $120,000 $140,000 Plus, COS offers: ? Upgrader producing light, sweet crude oil ? All of our reserves and resources ? Producing today 1. COS? value…
COS highlights 1. Largest ownership in Syncrude, a world-class asset 2. Opportunity to improve profitability ? higher production, lower costs 3. Well positioned during a period of low oil prices 4. Highly levered to oil price…
Mildred Lake Extension (MLX)
Syncrude Crown royalty terms* ? Greater of 25% net bitumen revenue less capital and operating costs, or 1% of gross bitumen revenue* ? Previously based on Synthetic Crude Oil (upgraded from bitumen) revenues and costs ? Repay $1.25…
2015 Crown royalty calculation 1. Bitumen revenue is based on an SCO yield of 85% and a bitumen price equal to 60% of C$WTI. 2. Royalty rate is the greater of 25% of net revenue or 1% of revenue. 3. Before capitalized interest. 4. As…
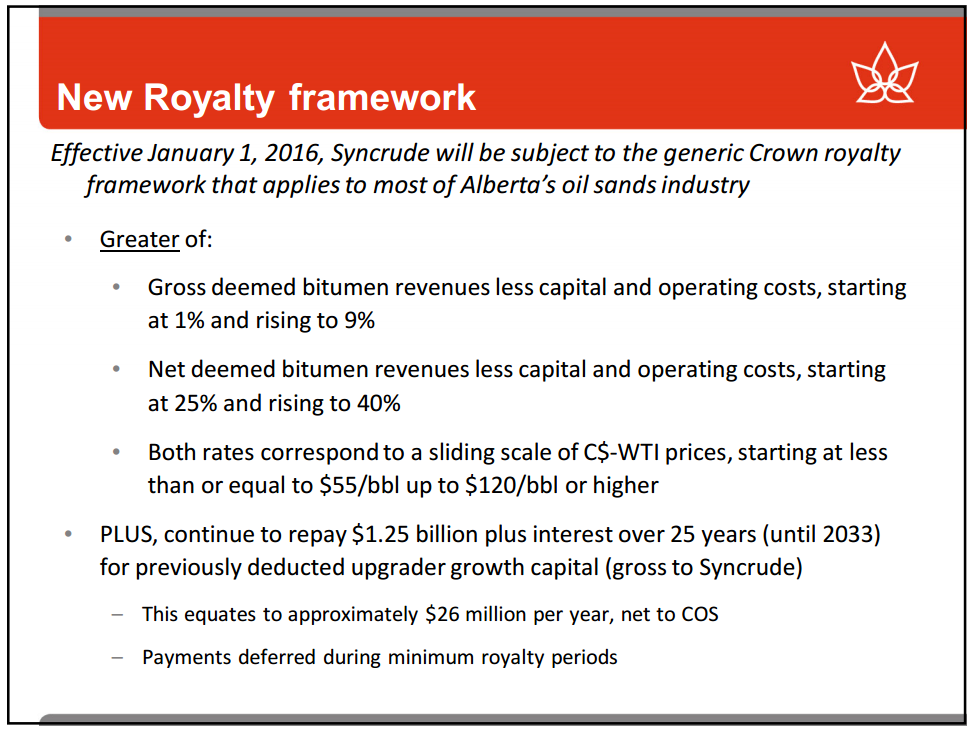
New Royalty framework ? Greater of: ? Gross deemed bitumen revenues less capital and operating costs, starting at 1% and rising to 9% ? Net deemed bitumen revenues less capital and operating costs, starting at 25% and rising to 40%…
Existing and Proposed Canadian & U.S. Crude Oil Pipelines Source: CAPP, June 2015
WCSB takeaway capacity vs. supply forecast Enbridge Mainline Trans Mountain Express PADD IV Source: CAPP, June 2015
Syncrude: a leader in responsible oil sands development Reflects industry best practices ? Mining Association ? Toward Sustainable Mining ? Canadian Association of Petroleum Producers ? Responsible Canadian Energy Program ? Canadian…
 Loading...