Agenda Overview 2Q 2015 results Russia Business Progress Looking ahead Q&A
A clear set of near-term priorities Delivery Ongoing safe, reliable and efficient execution Divestments $7.4bn against $10bn programme Discipline Reset of capital and cost base Dividend Focus on rebalancing financial framework
Resetting capital and cash costs Right-sizing the groups cost base well underway 2015 capital expenditure below $20 bn Deflation becoming evident in the sector Rest of cash costs delivering results - Across businesses and at a corporate…
A business model for the future Rebalancing group financial framework over a 2 year period Refreshing our model for longer term shareholder value Value over volume Disciplined investment to grow our portfolio over time Sustaining activity…
2Q 2015 Summary Underlying earnings figures are adjusted for the costs associated with the Gulf of Mexico spill, other non-operating items and fair value accounting effects. $bn Upstream Downstream Other businesses & Corporate…
Upstream (excluding Russia) Realisations Volume Underlying RCPBIT $bn 2Q14 3Q14 4Q14 1Q15 2Q15 Liquids $/bbl Gas $/mcf $/mcf mboe/d Total production excluding Russia Non-US US Total RCPBIT
Gulf of Mexico oil spill costs and provisions pre-tax $bn Income statement To end 2014 1Q 2015 2Q 2015 Cumulative to date Income statement Charge (credit) for the period Balance sheet Brought forward Charge (credit) to income…
Sources and uses of cash 1H 2014 1H 2015 $bn Disposals Underlying cash flow Gulf of Mexico oil spill Share buybacks Dividends Inorganic capex Organic capex Sources Uses
Financial Framework Financial outlook Near term Complete $10bn divestment programme Capital expenditure below $20bn in 2015 Ongoing reset of the cash cost base Medium/long term Financial framework rebalanced to weaker environment Gearing…
Russia Rosneft shareholding Rosneft AGM Dividend approved and paid Bob dudley re-elected to the Board Guillermo Quintero elected to the Board BP in Russia Agreements to purchase 20% of Taas Yuryakh Neftegazodobycha, in Eastern Siberia…
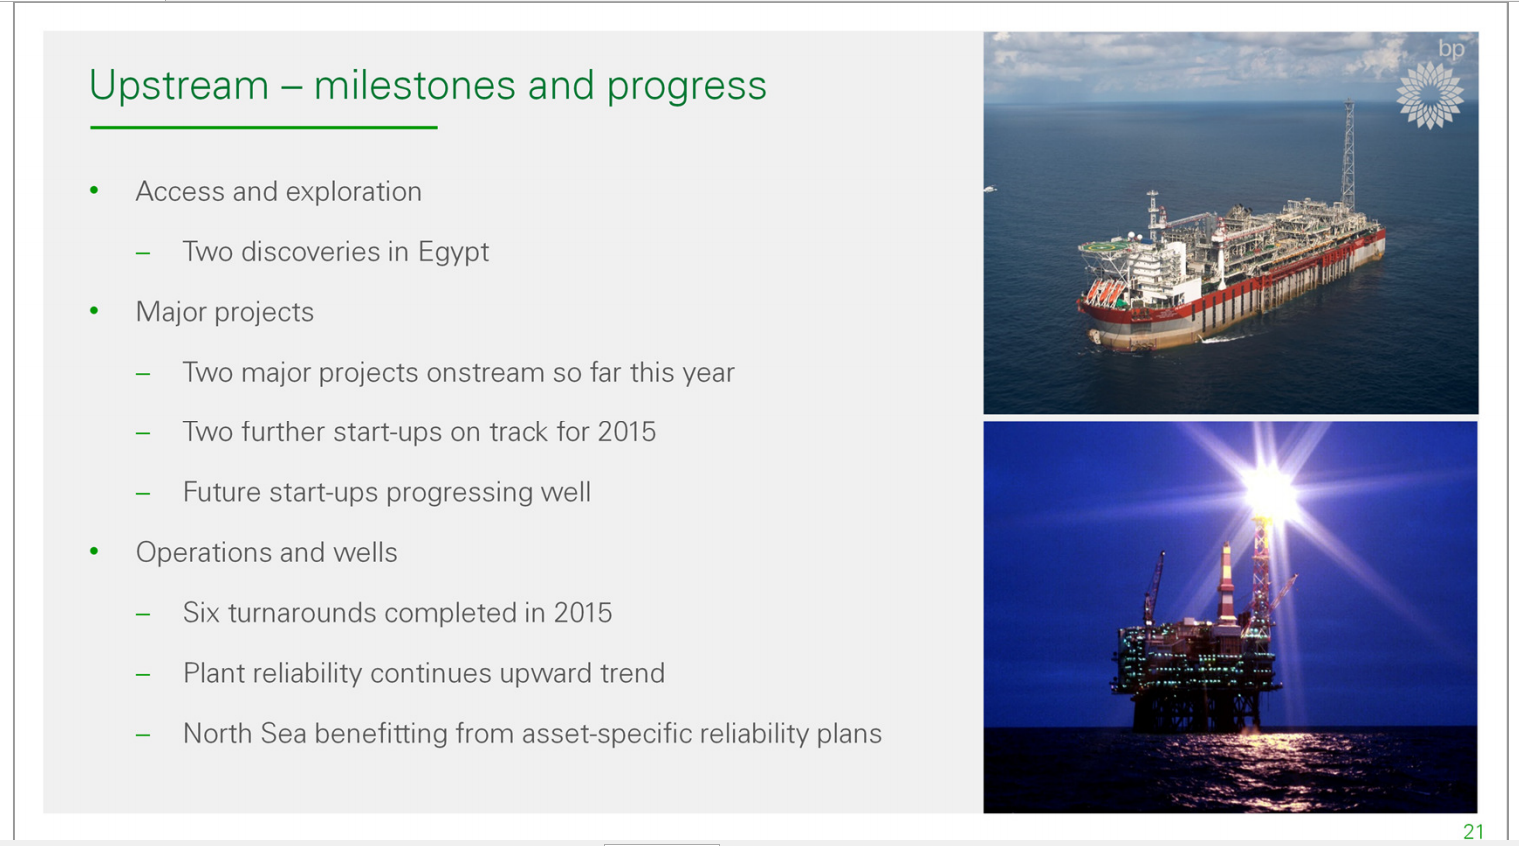
Upstream - milestones and progress Access and exploration Two discoveries in Egypt Major projects Two major projects onstrream so far this year Two further start-ups on track for 2015 Future start-ups progressing well Operations and…
Upstream - capital and cost reset Deflation and contract management Simplification and efficiency efforts Optimising activites and processes Right-sizing the organisation Capital discipline Quality through choice Scope optimisation US…
Downstream - simplification and efficiency A simplified business model and portfolio Consolidation of Fuels businesses Simplification of Lubricants business structure Streaming our head office functions Manufacturing efficiency…
Looking ahead Clear near-term priorities Delivery:safe, reliable and efficient execution Divestments: completion of $10bn programme Discipline: capital and cost reset Dividend: focus on rebalancing sources and uses of cash Developing…
 Loading...