Skip to main content Woodford Shale: From Hydrocarbon Source Rock to Reservoir – Oklahoma Geological Survey Investor Presentation | Shale Experts
Loading...

Woodford Shale: From Hydrocarbon Source Rock to Reservoir – Oklahoma Geological Survey

Oklahoma Geological Survey · Apr 11, 2013 · 78 slides

Investor presentation from the Shale Experts oil & gas presentation and slide database. Every page is imaged and its text indexed for search across operators, plays, basins and time.

Slides

  1. Woodford Shale: From Hydrocarbon Source Rock to Reservoir – Oklahoma Geological Survey – slide 1
    AAPG Woodford Shale Forum April 11, 2013 Woodford Shale: From Hydrocarbon Source Rock to Reservoir Brian J. Cardott Oklahoma Geological Survey
  2. Woodford Shale: From Hydrocarbon Source Rock to Reservoir – Oklahoma Geological Survey – slide 2
    Outline of Presentation Woodford Shale: Terminology and distribution As a hydrocarbon source rock As a reservoir Hydrocarbon production
  3. Woodford Shale: From Hydrocarbon Source Rock to Reservoir – Oklahoma Geological Survey – slide 3
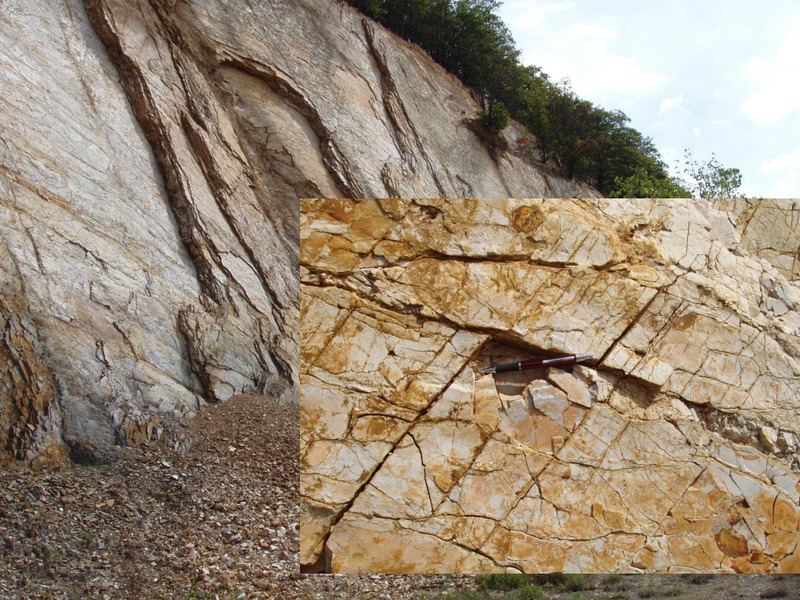
    Taff (1902) introduced the name Woodford Chert for outcrops north of the town of Woodford on the south side of the Arbuckle Mountains.
  4. Woodford Shale: From Hydrocarbon Source Rock to Reservoir – Oklahoma Geological Survey – slide 4
    WOODFORD CHERT: Taff (1902), Gould (1925), Wilmarth (1938) WOODFORD FORMATION: Morgan (1924), Amsden (1957, 1960); Wilson (1958), OBrien and Slatt (1990) WOODFORD SHALE: Tarr (1955), Jordan (1957, 1959, 1962), Urban (1960), Hass & Huddle…
  5. Woodford Shale: From Hydrocarbon Source Rock to Reservoir – Oklahoma Geological Survey – slide 5
    Woodford Shale Stratigraphy Based on conodonts, Hass and Huddle (1965) determined a Late Devonian (Frasnian) age for most of the formation; uppermost part is Early Mississippian (Kinderhookian) Unconformity
  6. Woodford Shale: From Hydrocarbon Source Rock to Reservoir – Oklahoma Geological Survey – slide 6
    Modified from Johnson and Cardott, 1992
  7. Woodford Shale: From Hydrocarbon Source Rock to Reservoir – Oklahoma Geological Survey – slide 7
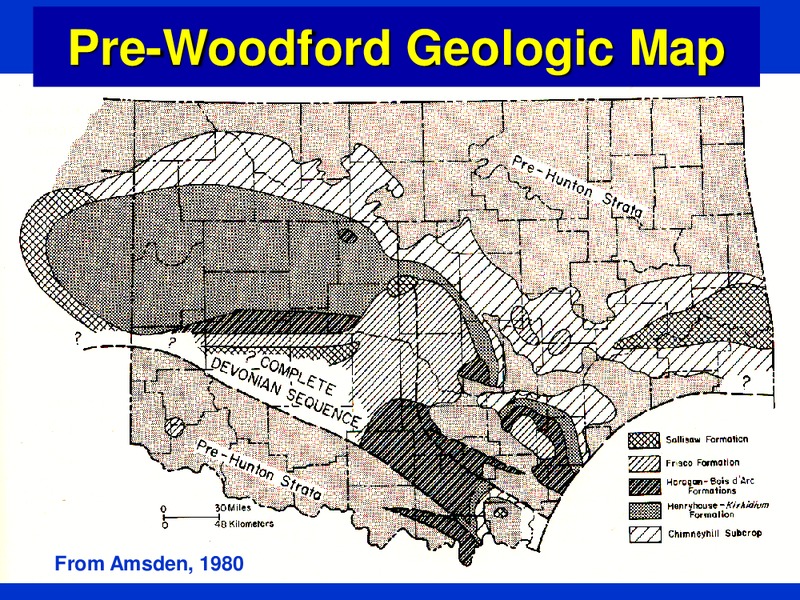
    Pre-Woodford Geologic Map From Amsden, 1980
  8. Woodford Shale: From Hydrocarbon Source Rock to Reservoir – Oklahoma Geological Survey – slide 8
    Woodford Shale Members Three informal members based on palynomorphs (Urban, 1960; Von Almen, 1970), geochemistry (Sullivan, 1985), log signatures (Hester and others, 1990; Lambert, 1993) From Hester and others (1990) [Anadarko Basin]
  9. Woodford Shale: From Hydrocarbon Source Rock to Reservoir – Oklahoma Geological Survey – slide 9
    USGS Bulletin 1866-D
  10. Woodford Shale: From Hydrocarbon Source Rock to Reservoir – Oklahoma Geological Survey – slide 10
    From Hester and others (1990) [Anadarko Basin]
  11. Woodford Shale: From Hydrocarbon Source Rock to Reservoir – Oklahoma Geological Survey – slide 11
    15 Stratigraphic Units Described by Caldwell, 2011
  12. Woodford Shale: From Hydrocarbon Source Rock to Reservoir – Oklahoma Geological Survey – slide 12
    Paleogeography and Facies Distribution in the Late Devonian Kirkland and others, 1992
  13. Woodford Shale: From Hydrocarbon Source Rock to Reservoir – Oklahoma Geological Survey – slide 13
    Isopach Map of Woodford Shale Comer, 1992
  14. Woodford Shale: From Hydrocarbon Source Rock to Reservoir – Oklahoma Geological Survey – slide 14
    Gas Shales Gas shales are varieties of hydrocarbon source rocks (an important part of a petroleum system). HYDROCARBON SOURCE ROCK CLASSIFICATION Organic matter type refers to the kerogen or maceral type and can be lumped into gas…
  15. Woodford Shale: From Hydrocarbon Source Rock to Reservoir – Oklahoma Geological Survey – slide 15
    Woodford Shale as a Hydrocarbon Source Rock Type II Kerogen (oil generative organic matter) High total organic carbon (TOC) Contains vitrinite (vitrinite reflectance analysis) to determine thermal maturity
  16. Woodford Shale: From Hydrocarbon Source Rock to Reservoir – Oklahoma Geological Survey – slide 16
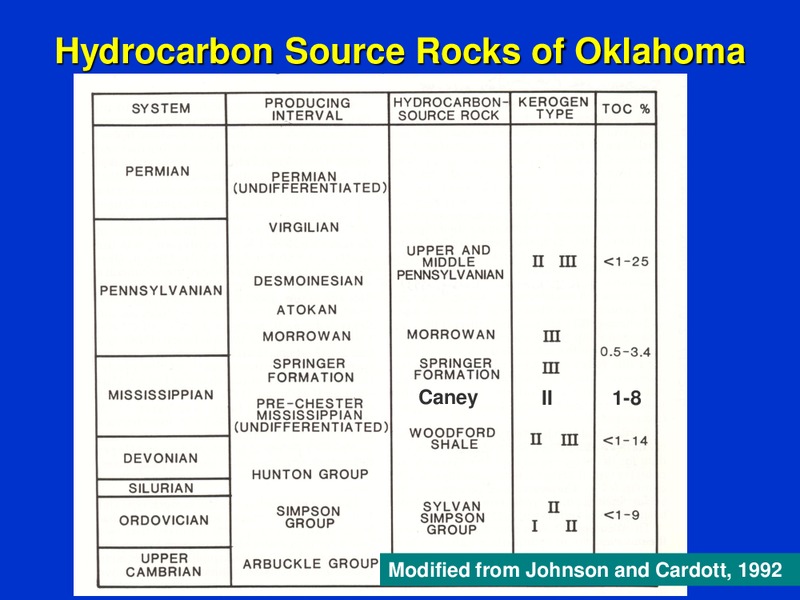
    Hydrocarbon Source Rocks of Oklahoma Caney II 1-8 Modified from Johnson and Cardott, 1992
  17. Woodford Shale: From Hydrocarbon Source Rock to Reservoir – Oklahoma Geological Survey – slide 17
    Woodford Shale From Comer, 1992
  18. Woodford Shale: From Hydrocarbon Source Rock to Reservoir – Oklahoma Geological Survey – slide 18
    Gamma ray plotted full scale shows details TOC is highest in fissile shale From Paxton and Cardott, 2008
  19. Woodford Shale: From Hydrocarbon Source Rock to Reservoir – Oklahoma Geological Survey – slide 19
    Vitrinite is a coal maceral (organic) derived from the cell wall material or woody tissues of vascular plants (post Silurian)
  20. Woodford Shale: From Hydrocarbon Source Rock to Reservoir – Oklahoma Geological Survey – slide 20
    Vitrinite Reflectance (%Ro) is a measurement of the percentage of light reflected off the vitrinite maceral at high (500X) magnification in oil immersion (average of many values)
  21. Woodford Shale: From Hydrocarbon Source Rock to Reservoir – Oklahoma Geological Survey – slide 21
    Woodford Shale is the oldest rock in Oklahoma that contains wood (vitrinite) from the progymnosperm Archaeopteris (organ genus Callixylon)
  22. Woodford Shale: From Hydrocarbon Source Rock to Reservoir – Oklahoma Geological Survey – slide 22
    Guidelines for the Barnett Shale (Based on Rock-Eval Pyrolysis) VRo Values Maturity
  23. Woodford Shale: From Hydrocarbon Source Rock to Reservoir – Oklahoma Geological Survey – slide 23
    Woodford Shale as a Reservoir Rock Biogenic Silica Rich (Brittle) Porous organic matter network
  24. Woodford Shale: From Hydrocarbon Source Rock to Reservoir – Oklahoma Geological Survey – slide 24
    Woodford Mineralogy [grab samples] A B C D E Quartz 63-68% 29-87% 30-60% 9-61% 27-53% K-Feldspar 4% 0-2% 2-10% 2-42% 0-2% Plagioclase 3% 1-4% Calcite 10% 5-25% 0-7% 0-11% Dolomite 6-9% 0-56% 0-5% 0-10% 0-6% Pyrite 5-7% 0-1% 0-5% 2-30%…
  25. Woodford Shale: From Hydrocarbon Source Rock to Reservoir – Oklahoma Geological Survey – slide 25
    Rather than depending on the mineralogy of grab samples, a better approach to shale mineralogy distribution is by electric logs such as the Elemental Capture Spectroscopy log
  26. Woodford Shale: From Hydrocarbon Source Rock to Reservoir – Oklahoma Geological Survey – slide 26
  27. Woodford Shale: From Hydrocarbon Source Rock to Reservoir – Oklahoma Geological Survey – slide 27
    Extent of Biogenic Silica in the Woodford Comer, 2008 AAPG Poster
  28. Woodford Shale: From Hydrocarbon Source Rock to Reservoir – Oklahoma Geological Survey – slide 28
    The primary mechanism of gas [& oil] production from shales is the fracture network in the reservoir. Gas residing in the very tight matrix system is forced to flow into the fracture network, first through chemical desorption and then…
  29. Woodford Shale: From Hydrocarbon Source Rock to Reservoir – Oklahoma Geological Survey – slide 29
    Genetic Bitumen Classification Pre-Oil Solid Bitumen: early-generation products of rich source rocks, probably extruded from their sources as a very viscous fluid, and migrated the minimum distance necessary to reach fractures and voids…
  30. Woodford Shale: From Hydrocarbon Source Rock to Reservoir – Oklahoma Geological Survey – slide 30
    Two Common Pre-Oil Bitumen Optical Forms Based on Landis and Castao (1994) [regression equation is based on homogenous form] Homogenous form Granular form OPL 1333 500X OPL 1076 500X
  31. Woodford Shale: From Hydrocarbon Source Rock to Reservoir – Oklahoma Geological Survey – slide 31
    Use of pre-oil solid bitumen as thermal maturity indicator following solid hydrocarbon reflectance to vitrinite reflectance equivalent regression equation of Landis and Castao (1994) VRE = (BRo + 0.41)/1.09
  32. Woodford Shale: From Hydrocarbon Source Rock to Reservoir – Oklahoma Geological Survey – slide 32
    Post-Oil Bitumen Network Classification ( 500X) [primary oil migration] Speckled Wispy Connected OPL 1368 OPL 1372 OPL 1366
  33. Woodford Shale: From Hydrocarbon Source Rock to Reservoir – Oklahoma Geological Survey – slide 33
    Nanopores associated with organic matter using ion milling and SEM (from Loucks and others, 2009)
  34. Woodford Shale: From Hydrocarbon Source Rock to Reservoir – Oklahoma Geological Survey – slide 34
    Curtis and others, 2012
  35. Woodford Shale: From Hydrocarbon Source Rock to Reservoir – Oklahoma Geological Survey – slide 35
    Focused Ion Beam (FIB) milling + SEM Backscatter Electron Imaging: Higher thermal maturity (1.4% Ro; OPL 1387) Woodford Shale core containing wispy post-oil bitumen network 500X
  36. Woodford Shale: From Hydrocarbon Source Rock to Reservoir – Oklahoma Geological Survey – slide 36
    Higher magnification of previous slide showing nanoporosity in wispy post-oil bitumen network
  37. Woodford Shale: From Hydrocarbon Source Rock to Reservoir – Oklahoma Geological Survey – slide 37
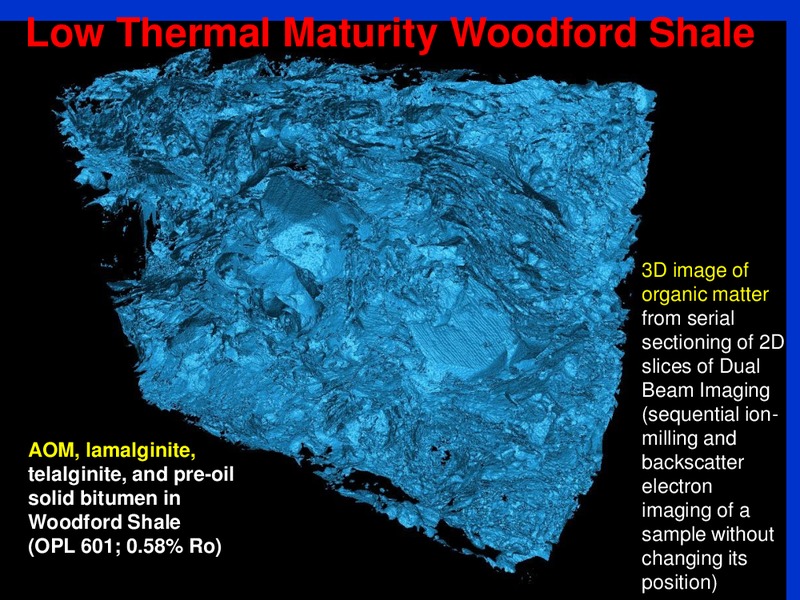
    Low Thermal Maturity Woodford Shale 3D image from serial sectioning of 2D slices of Dual Beam Imaging (sequential ion- milling and backscatter AOM, lamalginite, electron telalginite, and pre-oil imaging of a solid bitumen…
  38. Woodford Shale: From Hydrocarbon Source Rock to Reservoir – Oklahoma Geological Survey – slide 38
    Low Thermal Maturity Woodford Shale 3D image of organic matter from serial sectioning of 2D slices of Dual Beam Imaging (sequential ion- milling and AOM, lamalginite, backscatter telalginite, and pre-oil electron solid…
  39. Woodford Shale: From Hydrocarbon Source Rock to Reservoir – Oklahoma Geological Survey – slide 39
    Woodford Production: Where are the Woodford Shale plays in Oklahoma Why are the plays where they are What types of hydrocarbons are produced
  40. Woodford Shale: From Hydrocarbon Source Rock to Reservoir – Oklahoma Geological Survey – slide 40
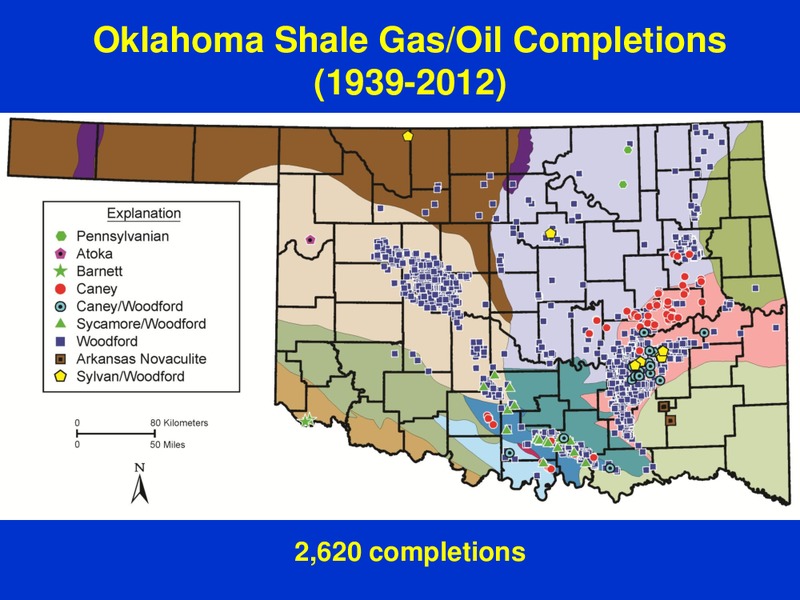
    Oklahoma Shale Gas/Oil Completions (1939-2012) 2,620 completions
  41. Woodford Shale: From Hydrocarbon Source Rock to Reservoir – Oklahoma Geological Survey – slide 41
    Woodford Shale Completions (2004-2012) Woodford Shale Completions (2004-2012) [emphasis on liquid 534 hydrocarbons]
  42. Woodford Shale: From Hydrocarbon Source Rock to Reservoir – Oklahoma Geological Survey – slide 42
    Woodford Shale Plays 4Biogenic Methane 2Condensate 1Dry Gas 3Oil Geologic provinces from Northcutt and Campbell, 1995
  43. Woodford Shale: From Hydrocarbon Source Rock to Reservoir – Oklahoma Geological Survey – slide 43
    2,461 Woodford Shale Wells (2004-2012) 376 2,085
  44. Woodford Shale: From Hydrocarbon Source Rock to Reservoir – Oklahoma Geological Survey – slide 44
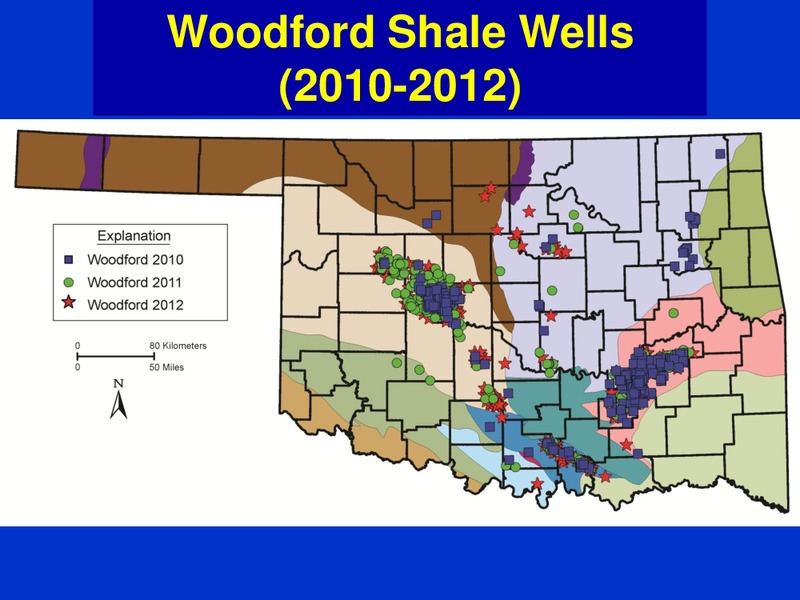
    Woodford Shale Wells (2010-2012)
  45. Woodford Shale: From Hydrocarbon Source Rock to Reservoir – Oklahoma Geological Survey – slide 45
    Woodford Shale Wells (2012-2010)
  46. Woodford Shale: From Hydrocarbon Source Rock to Reservoir – Oklahoma Geological Survey – slide 46
    Woodford Shale IP Gas vs. Depth 2,348 Woodford-only wells: (2004-2012) 320 vertical: depth 430-13,046 ft, IP 1-2,681 Mcfd; 2,028 horizontal: depth 786-16,259 ft TVD, IP 3- 12,097 Mcfd
  47. Woodford Shale: From Hydrocarbon Source Rock to Reservoir – Oklahoma Geological Survey – slide 47
    Woodford Shale Horizontal Well Laterals (2005-2012) 13,378 ft
  48. Woodford Shale: From Hydrocarbon Source Rock to Reservoir – Oklahoma Geological Survey – slide 48
    Emphasis of presentation will be on the importance of thermal maturity (by vitrinite reflectance) on the Woodford Shale oil and gas plays.
  49. Woodford Shale: From Hydrocarbon Source Rock to Reservoir – Oklahoma Geological Survey – slide 49
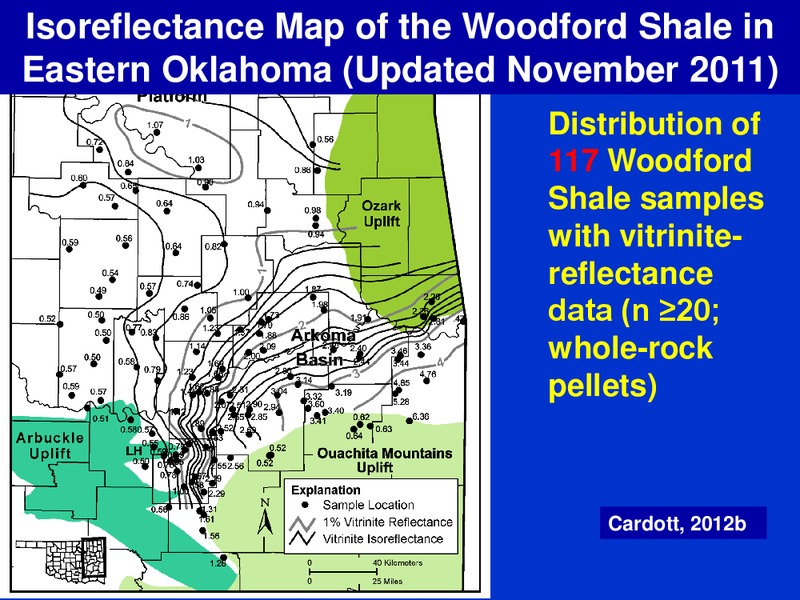
    Isoreflectance Map of the Woodford Shale in Eastern Oklahoma (Updated November 2011) Distribution of 117 Woodford Shale samples with vitrinite- reflectance data (n 20; whole-rock pellets) Cardott, 2012b
  50. Woodford Shale: From Hydrocarbon Source Rock to Reservoir – Oklahoma Geological Survey – slide 50
    Woodford Shale Structure & Vitrinite 1 Isoreflectance 2 3 Map 4 Maps prepared by R. Vance Hall using Petra Cardott, 2012b
  51. Woodford Shale: From Hydrocarbon Source Rock to Reservoir – Oklahoma Geological Survey – slide 51
    Most of the following maps are from an August 2011 presentation and have not been updated (published in 2012).
  52. Woodford Shale: From Hydrocarbon Source Rock to Reservoir – Oklahoma Geological Survey – slide 52
    Cardott, 2012b
  53. Woodford Shale: From Hydrocarbon Source Rock to Reservoir – Oklahoma Geological Survey – slide 53
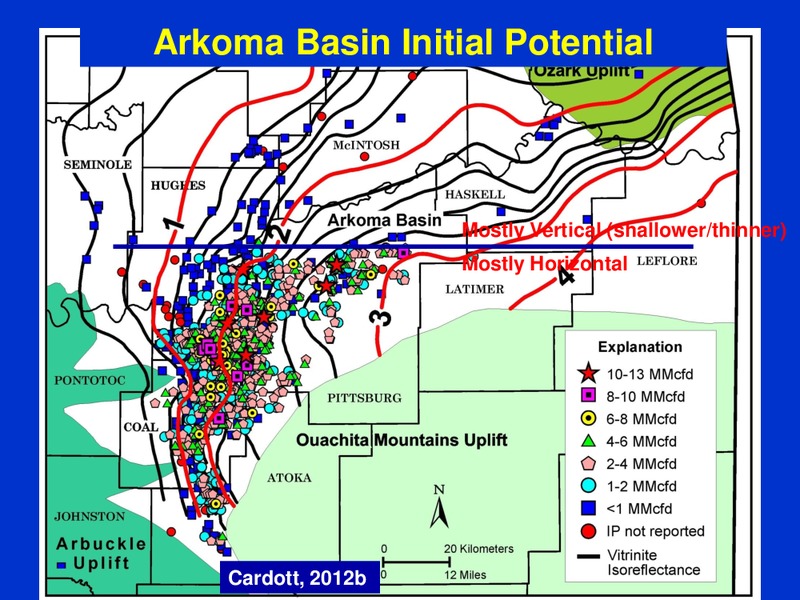
    Arkoma Basin Initial Potential Mostly Vertical (shallower/thinner) Mostly Horizontal Cardott, 2012b
  54. Woodford Shale: From Hydrocarbon Source Rock to Reservoir – Oklahoma Geological Survey – slide 54
    Woodford Oil/Condensate/Gas Production Caveat Gas production is reported by the Oklahoma Corporation Commission by WELL. Oil/condensate production is reported by the Oklahoma Tax Commission by LEASE [production by well is only on…
  55. Woodford Shale: From Hydrocarbon Source Rock to Reservoir – Oklahoma Geological Survey – slide 55
    Woodford Shale Oil/Condensate/Gas Production (2004-2011) Production in first few months is interpreted as flowback from oil-based drilling mud Condensate based on 54.4 API DEG Cardott, 2012b
  56. Woodford Shale: From Hydrocarbon Source Rock to Reservoir – Oklahoma Geological Survey – slide 56
    (1) Newfield 3H-36 Genevieve (36-6N-11E; Hughes Co.; IP 2,118 Mcfd) Liquids production only in first few 2.05%VRo months interpreted as flowback
  57. Woodford Shale: From Hydrocarbon Source Rock to Reservoir – Oklahoma Geological Survey – slide 57
    (2) Cimarex 3-34H Hall (34-3N-11E; Coal Co.; IP 1,740 Mcfd) Intermittent liquids production in 2.05%VRo first few months interpreted as oil- based drilling mud flowback
  58. Woodford Shale: From Hydrocarbon Source Rock to Reservoir – Oklahoma Geological Survey – slide 58
    Woodford Shale-Only Condensate Wells Excluding Early Month Spikes Cardott, 2012b
  59. Woodford Shale: From Hydrocarbon Source Rock to Reservoir – Oklahoma Geological Survey – slide 59
    Andrews, 2009
  60. Woodford Shale: From Hydrocarbon Source Rock to Reservoir – Oklahoma Geological Survey – slide 60
    3 4
  61. Woodford Shale: From Hydrocarbon Source Rock to Reservoir – Oklahoma Geological Survey – slide 61
    (3) St. Mary Land & Exploration 3-14 Marvin (14-1N-10E; Coal Co.; IP 3,125 Mcfd) Example of Woodford condensate 1.67%VRo produced later in wells life
  62. Woodford Shale: From Hydrocarbon Source Rock to Reservoir – Oklahoma Geological Survey – slide 62
    (4) Antero 30-1H Harris (30-1S-11E; Coal Co.; IP 1,334 Mcfd) Spikes in production may be from intermittent trucking 1.6%VRo
  63. Woodford Shale: From Hydrocarbon Source Rock to Reservoir – Oklahoma Geological Survey – slide 63
    Arkoma Woodford IP Liquids (BPD) (2004-2012)
  64. Woodford Shale: From Hydrocarbon Source Rock to Reservoir – Oklahoma Geological Survey – slide 64
    Woodford Shale Structure Map Peace 1994 Amsden, 1975
  65. Woodford Shale: From Hydrocarbon Source Rock to Reservoir – Oklahoma Geological Survey – slide 65
    Woodford Shale Structure Map Peace, 1994
  66. Woodford Shale: From Hydrocarbon Source Rock to Reservoir – Oklahoma Geological Survey – slide 66
    Anadarko Basin Woodford Shale Isoreflectance Map based on 81 wells (Cardott, 1989)
  67. Woodford Shale: From Hydrocarbon Source Rock to Reservoir – Oklahoma Geological Survey – slide 67
    Anadarko Basin Initial Potential (Cana Play Beginning in 2007) Cardott, 2012b
  68. Woodford Shale: From Hydrocarbon Source Rock to Reservoir – Oklahoma Geological Survey – slide 68
    Anadarko Basin Produced Liquids USING THE SAME CRITERIA AS FOR THE ARKOMA BASIN TO EXCLUDE WELLS WITH LOW AMOUNTS OF EARLY LIQUID PRODUCTION Cardott, 2012b
  69. Woodford Shale: From Hydrocarbon Source Rock to Reservoir – Oklahoma Geological Survey – slide 69
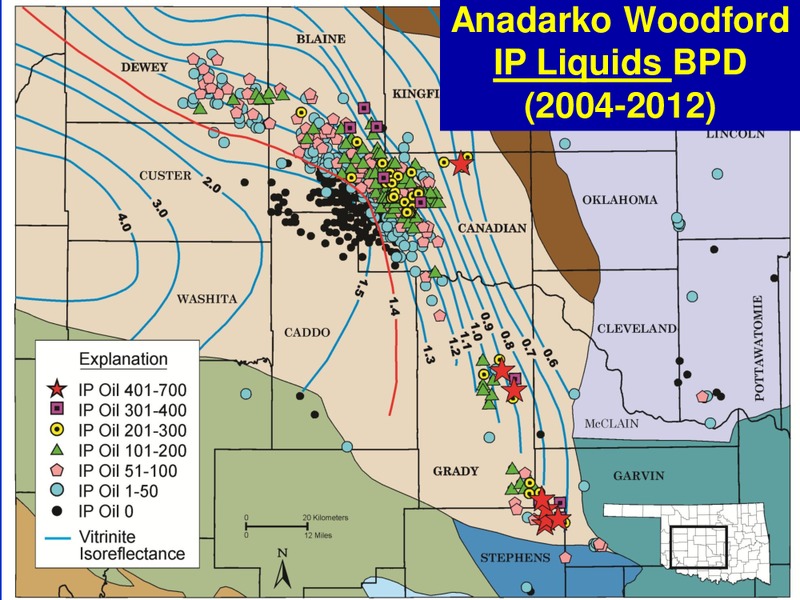
    Anadarko Woodford IP Liquids BPD (2004-2012)
  70. Woodford Shale: From Hydrocarbon Source Rock to Reservoir – Oklahoma Geological Survey – slide 70
    Woodford Shale VRo on Structure Cardott, 2012b
  71. Woodford Shale: From Hydrocarbon Source Rock to Reservoir – Oklahoma Geological Survey – slide 71
    Woodford Shale IPs on Structure Cardott, 2012b
  72. Woodford Shale: From Hydrocarbon Source Rock to Reservoir – Oklahoma Geological Survey – slide 72
    Shale Oil Plays The Bakken Shale (Late Devonian-Early Mississippian; North Dakota & Montana) is the analog for shale oil plays. However, the reservoir of the Bakken is a permeable, non-shale middle member. Other formations considered…
  73. Woodford Shale: From Hydrocarbon Source Rock to Reservoir – Oklahoma Geological Survey – slide 73
    Woodford Production on Structure Oil production from silica-rich rock is from natural fractures Cardott, 2012b
  74. Woodford Shale: From Hydrocarbon Source Rock to Reservoir – Oklahoma Geological Survey – slide 74
    Ardmore Woodford IP Liquids BPD (2004-2012)
  75. Woodford Shale: From Hydrocarbon Source Rock to Reservoir – Oklahoma Geological Survey – slide 75
    http://www.ogs.ou.edu For more information, please visit the Oklahoma Geological Survey Web Site
  76. Woodford Shale: From Hydrocarbon Source Rock to Reservoir – Oklahoma Geological Survey – slide 76
  77. Woodford Shale: From Hydrocarbon Source Rock to Reservoir – Oklahoma Geological Survey – slide 77
    2,768 records
  78. Woodford Shale: From Hydrocarbon Source Rock to Reservoir – Oklahoma Geological Survey – slide 78
    THANK YOU Typical Calf Creek point of Woodford chert found in Haskell County, Oklahoma (Norman Transcript, March 11, 2007, p. E1)

From the store

Browse maps, data & reports in the Shale Experts store