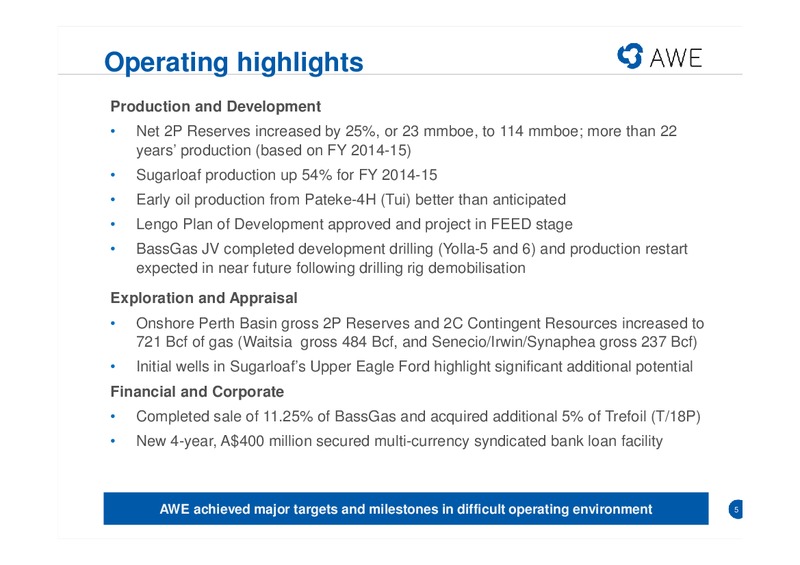
Operating highlights Production and Development Net 2P Reserves increased by 25%, or 23 mmboe, to 114 mmboe; more than 22 years production (based on FY 2014-15) Sugarloaf production up 54% for FY 2014-15 Early oil production from…
Focused on delivery Key Indicator Guidance FY 2014-15 Actual FY 2014-15 Production (million BOE) 4.6 5.1 5.1 Sales Revenue (m) 290 320 284 Development Expenditure (m) 220 250 243 Exploration Expenditure (m) 50-75 63 Achieved…
Financial summary Total Production for FY 2014-15 5.1 million BOE, down 9% on pcp Sales Revenue 284 million, down 14% on pcp Field EBITDAX 143 million, down 31% on pcp Statutory net loss after tax 230 million Underlying net loss…
Disciplined financial management In a low oil price environment, AWE aims to achieve its annual targets and strategic goals by: Maximising operating cash flows Maintaining balance sheet flexibility Actively assessing returns on…
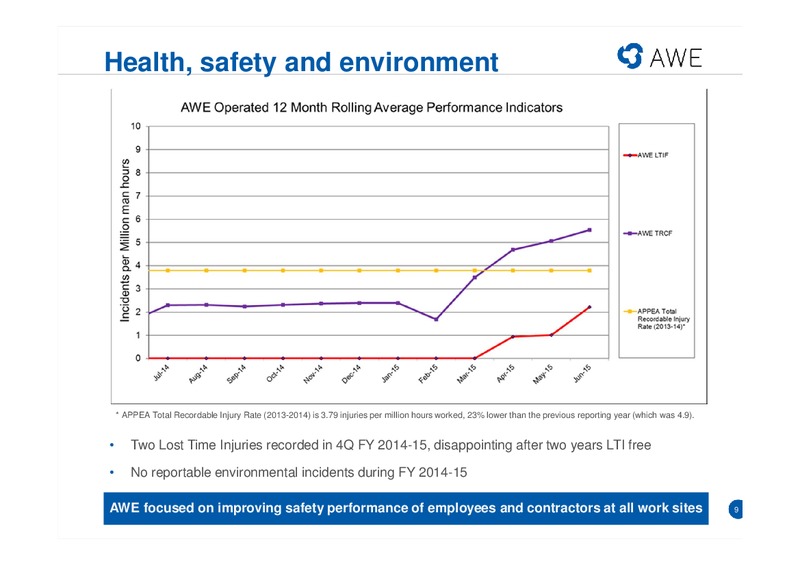
Health, safety and environment * APPEA Total Recordable Injury Rate (2013-2014) is 3.79 injuries per million hours worked, 23% lower than the previous reporting year (which was 4.9). Two Lost Time Injuries recorded in 4Q FY…
Reserves & Resources As at 30 June 2015 10
Reserves & Resources continue to grow Note: Includes recently announced changes to onshore Perth Basin net 2P Reserves and 2C Contingent Resources announced 21 August 2015 More than 22 years of 2P production (based on current…
Potential to increase 2P Reserves Ability to convert majority of 2C Resources into 2P Reserves in short to medium term 12
Latest Perth Basin 2P and 2C estimates Onshore Perth Basin represents substantial gross 2P Reserves and 2C Contingent Resources with 721 Bcf of gas (359 Bcf of gas or 65 mmboe net to AWE) booked: o Waitsia gross 2P plus 2C now 484 Bcf…
Financial Performance For the 12 months to 30 June 2015 14
Earnings analysis Non-cash impairments INSERT andTEXT low oil WHEN prices DATA severely AVAILABLE impacted full year results 15
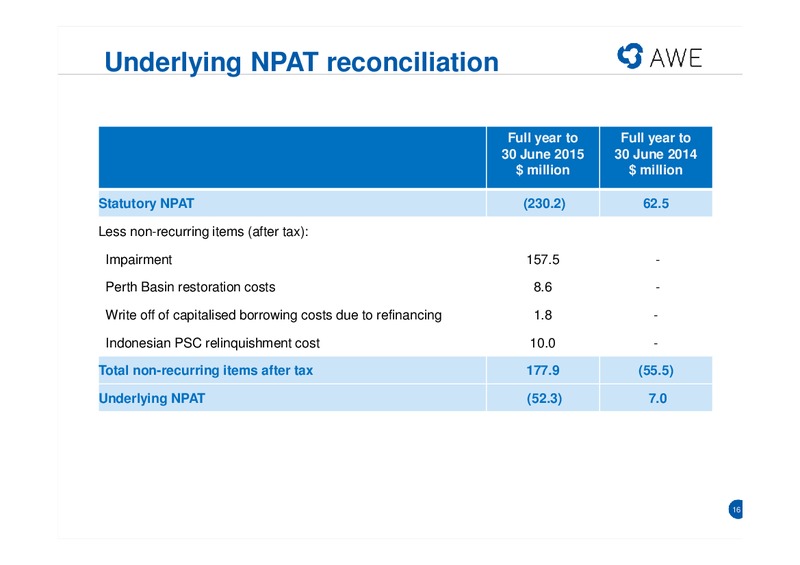
Underlying NPAT reconciliation Full year to Full year to 30 June 2015 30 June 2014 million million Statutory NPAT (230.2) 62.5 Less non-recurring items (after tax): Impairment 157.5 - Perth Basin restoration costs 8.6 - Write…
Non-cash impairments Non-cash impairment Non-cash impairment Oil producing asset before tax after tax Cliff Head Oil Project 26.9 million 11.3 million Tui Area Oil Project 67.4 million 39.5 million BassGas Project 150.7 million…
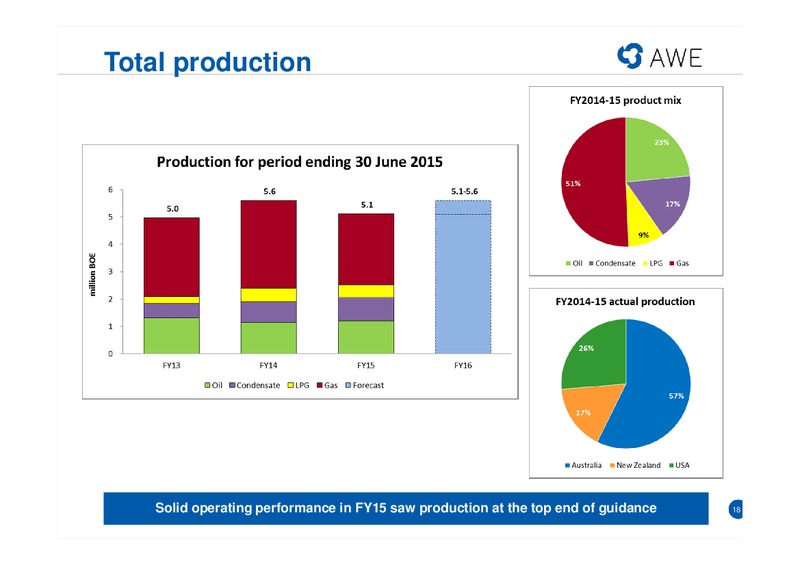
Total production Solid operating performance in FY15 saw production at the top end of guidance 18
Sales revenue Note: Guidance based on Brent oil price of US50/bbl Sales revenue 2% below guidance but positive result given low oil prices 19
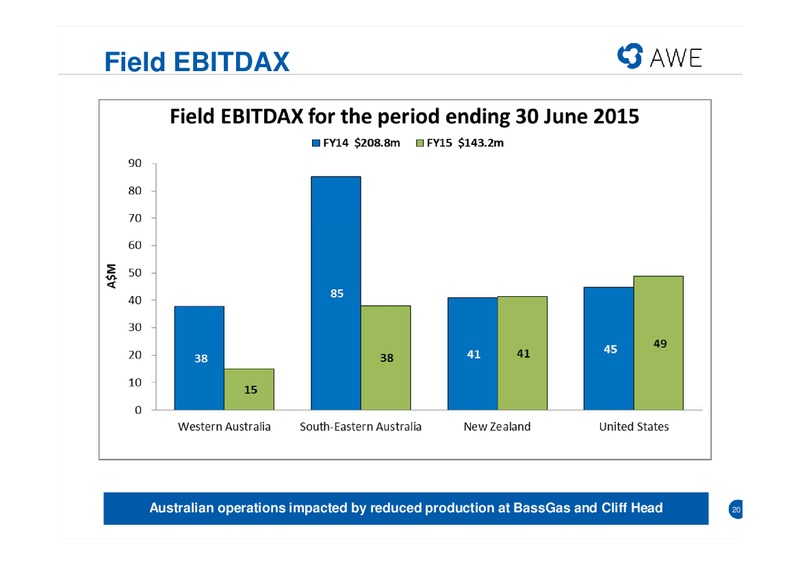
Field EBITDAX Australian operations impacted by reduced production at BassGas and Cliff Head 20
Cash flow analysis Borrowings increased to offset decline in oil revenues during peak investment spend 21
Investment Analysis Total investment expenditure forecast to decrease by 37% - 47% in FY16 22
Maintain tight financial discipline Maintain flexible balance sheet o Hedge production where appropriate o Exercise discretion on development costs if required o Carefully assess growth opportunities before committing to expansion o…
Strategic Initiatives 24
Tougher operating environment Brent / WTI Oil Prices (US/bbl) AUD/USD 120 0.95 100 0.90 80 0.85 60 40 0.80 20 0.75 0 0.70 Brent WTI LNG East Asia Index (US/mmbtu) China YoY GDP Growth (%) 7.6 15 7.5 14 7.4 13 7.3 12 7.2…
Diverse product mix provides stability Focused on markets with Australia High Value Gas pricing and Indonesia demand upside Long term price Indonesia, upside; China Oil favourable New Zealand currency Australia Liquids…
Development portfolio re-prioritised AWE remains focused on achieving annual production goal of 10 mmboe by the end of 2018 Waitsia development given high priority and early stage production targeting mid-2016 Lengo offshore Large…
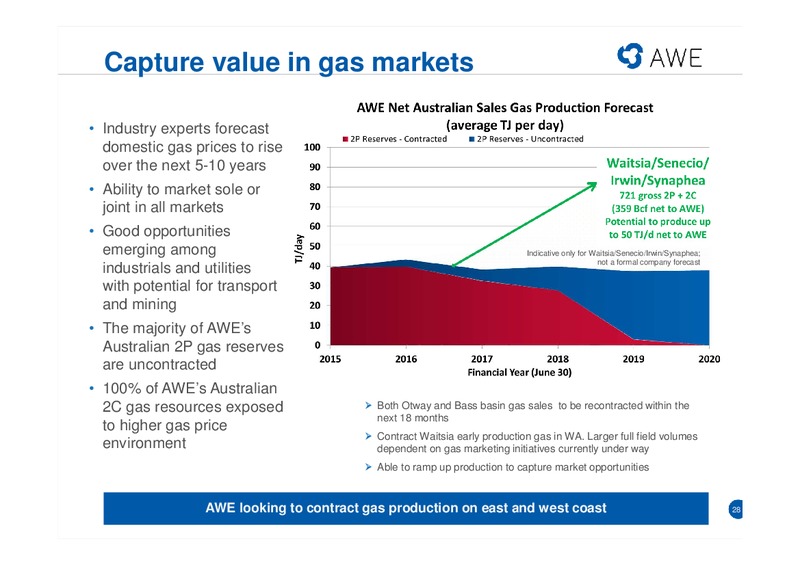
Capture value in gas markets Industry experts forecast domestic gas prices to rise over the next 5-10 years Ability to market sole or joint in all markets Good opportunities emerging among Indicative only for…
Growth Projects 29
Waitsia moves into development phase Very successful three well drilling program confirmed two significant commercial plays: o Kingia/High Cliff conventional gas play (Senecio-3, Waitsia-1 and 2) o Dongara/Wagina tight gas play…
BassGas increases production Drilling of two development wells (Yolla-5 and 6) completed and Yolla-6 brought onto production in July 2015 Expect full field production following demobilisation of drilling rig in Q3 CY2015 Heavy lift…
Inventory builds at Sugarloaf Prime US unconventional assets continue to Eagle Ford horizontal and provide good returns at current low oil prices vertical well spacing Sugarloaf is some of the best liquids-rich unconventional acreage…
AAL continues to make progress 100 mmbbl gross recoverable oil field development (K-Sand), offshore Indonesia FPSO and well head platform tender plans approved by Indonesian government FEED process well advanced Well head platform…
Lengo gas project gaining momentum Indonesian government has approved the Plan of Development for the Lengo gas project in the Bulu PSC offshore East Java POD comprises four development wells, an unmanned well head platform, and a…
Outlook 35
Guidance for FY2015-16 Guidance Key Indicator FY2015-16 Production (million BOE) 5.1 5.6 Sales Revenue (m) 225 - 250 Development Expenditure (m) 135 - 165 Exploration Expenditure (m) 25 Note: Guidance prepared using Brent…
Looking ahead growth projects First production from Waitsia; accelerating activity in the onshore Perth Basin o Low cost, early conventional production from existing wells by mid-2016 o Gas marketing for larger resource base under way…
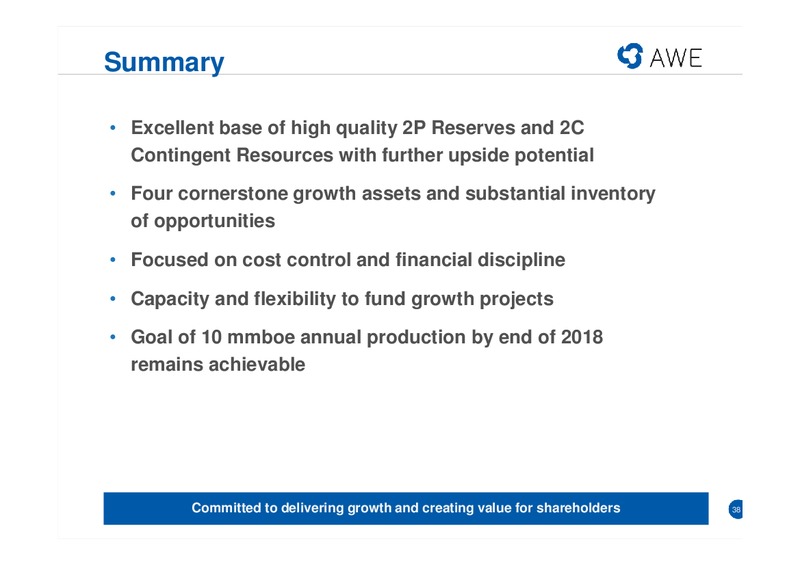
Summary Excellent base of high quality 2P Reserves and 2C Contingent Resources with further upside potential Four cornerstone growth assets and substantial inventory of opportunities Focused on cost control and financial…
Questions
Appendix Full year financials and supplementary information 40
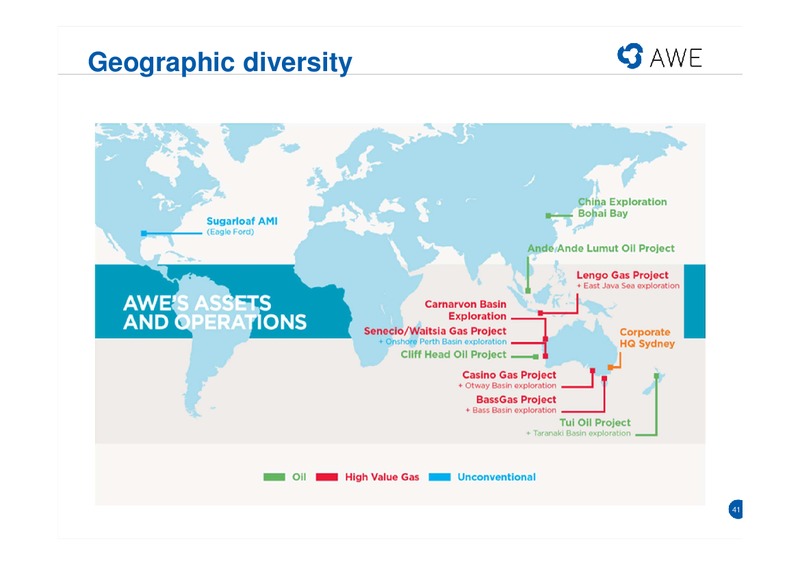
Geographic diversity 41
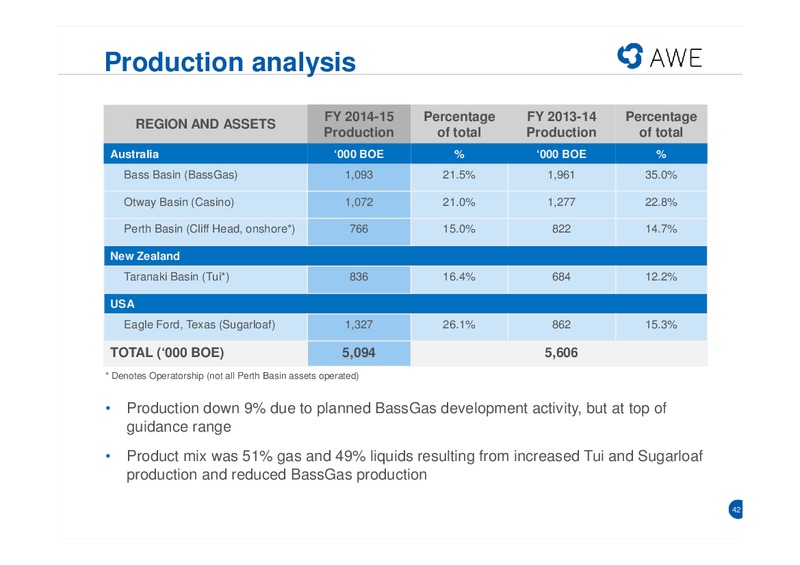
Production analysis FY 2014-15 Percentage FY 2013-14 Percentage REGION AND ASSETS Production of total Production of total Australia 000 BOE % 000 BOE % Bass Basin (BassGas) 1,093 21.5% 1,961 35.0% Otway Basin (Casino) 1,072 21.0%…
Full year earnings breakdown Full year to Full year to 30 Jun 2015 30 Jun 2014 million million Revenue 283.7 329.3 Operating Costs (140.5) (119.4) Amortisation (119.1) (117.6) Exploration costs expensed (37.6) (39.8) Asset…
Full year segmental reporting Total New Zealand South-Eastern Western United States Exploration Australia Australia millions 2015 2014 2015 2014 2015 2014 2015 2014 2015 2014 2015 2014 Sales revenue 283.7 328.3 80.9 61.6 70.8…
Full year cash flow analysis Full year to Full year to 30 June 2015 30 June 2014 million million Opening cash 42.1 41.1 Net cash flow from operations* 62.2 123.7 Asset acquisitions (12.2) (7.2) Asset disposals 56.3 102.8…
Balance Sheet summary Full year to Full year to 30 Jun 2015 30 Jun 2014 Balance sheet item million million Assets Cash and cash equivalents 46.6 42.1 Receivables and inventory 177.1 139.9 Exploration and evaluation assets 69.1…
AWE 2P Reserves as at 30 June 2015 2P Reserves Project/Area Equity (million boe) 13.4 BassGas 35% 13.4 23.0 8.2 BassGas Otway Basin 25% 8.2 1.6 Otway Basin Cliff Head 57.5% 1.6 Cliff Head Onshore PB Onshore PB 33-100% 17.4 17.4…
AWE 2C Resources as at 30 June 2015 2C Resources Project/Area Equity (million boe) 9.5 Bass Basin 35% 30.8 9.6 30.8 Bass Basin Otway Basin 25% 1.3 Otway Basin Cliff Head 57.5% 0.6 17.1 Cliff Head Onshore PB 1.3 Onshore PB 33-100%…
Conversion Tables Volume 1 cubic metre = 1 kilolitre = 35.3 cubic feet = 6.29 barrels 1 megalitre = 1,000 cubic metres Energy Value 1,000 standard cubic feet of sales gas yields about 1.055 gigajoules (GJ) of heat 1 petajoule…
Glossary AAL Ande Ande Lumut LPG Liquefied Petroleum Gas AMI Area of Mutual Interest LTI Lost Time Injuries Bcf Billion cubic feet MLE Mid Life Enhancement BOE Barrels of Oil Equivalent MMBOE Million Barrels of Oil Equivalent Bbls…
 Loading...