2015 full year results and FY16 outlook Ian Davies, Managing Director and CEO Brisbane, 25 August 2015
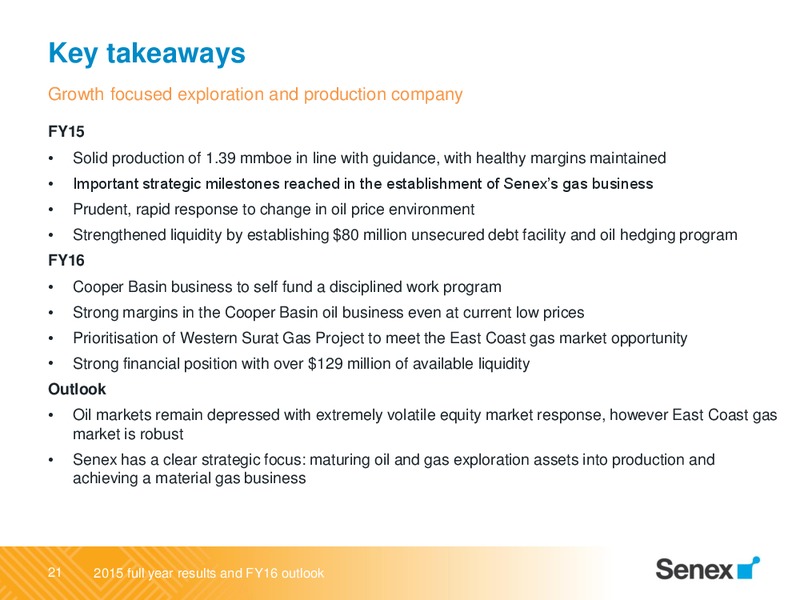
Key takeaways Maintaining financial strength is our number one business priority FY15 Solid production of 1.39 mmboe in line with guidance, with healthy margins maintained Important strategic milestones reached in the establishment of…
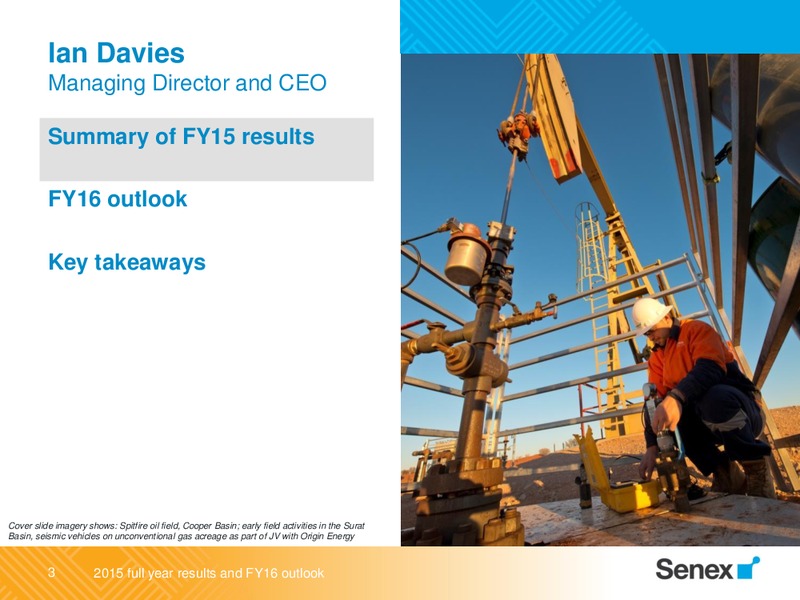
Ian Davies Managing Director and CEO Summary of FY15 results FY16 outlook Key takeaways Cover slide imagery shows: Spitfire oil field, Cooper Basin; early field activities in the Surat Basin, seismic vehicles on unconventional…
FY15 business highlights A number of strategic milestones reached during FY15 Strengthened financial position: establishment of 80 million unsecured debt facility and oil hedging to protect revenues in H2 FY15 and FY16 Corporate Key…
FY15 safety performance Continuing to improve safety performance Safety performance FY15 performance 10 1.10 1 lost time injury Hours Rate 8 8.62 6 recordable incidents, 4 involving third party 1.05 contractors 6 6.46…
FY15 key financial headlines Results impacted by lower oil price and reduced capital spend FY15 FY14 Change Production (mmboe) 1.39 1.38 1% Sales volumes (mmboe) 1.32 1.35 (2%) Average realised oil price (A per barrel) 88 127…
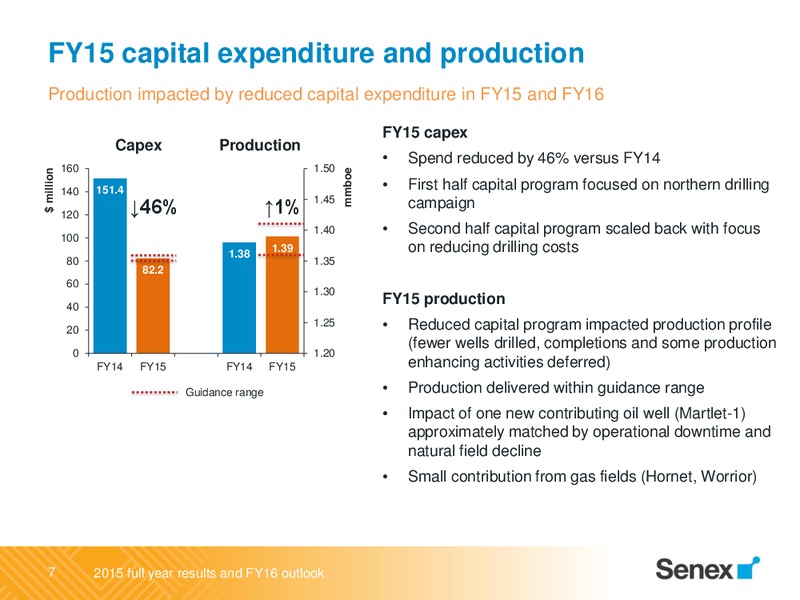
FY15 capital expenditure and production Production impacted by reduced capital expenditure in FY15 and FY16 FY15 capex Capex Production Spend reduced by 46% versus FY14 160 1.50 mmboe million 140 151.4 First half capital…
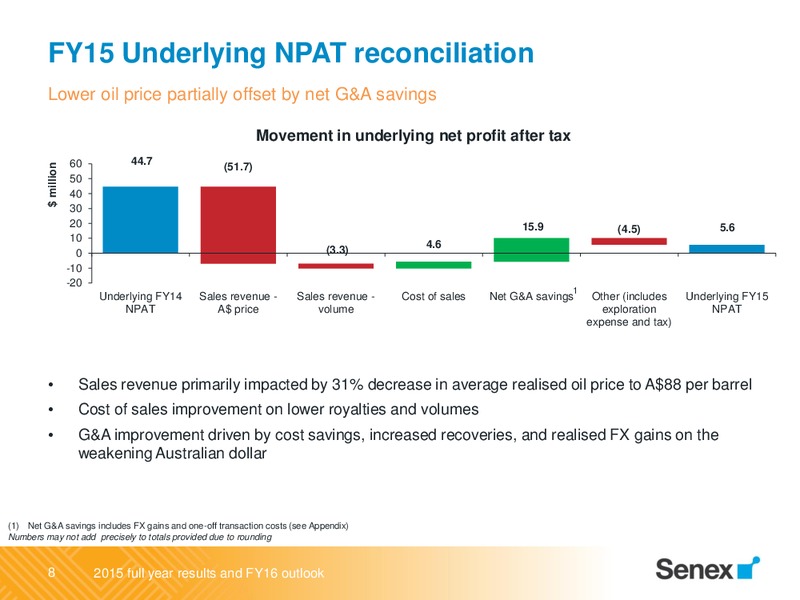
FY15 Underlying NPAT reconciliation Lower oil price partially offset by net G&A savings Movement in underlying net profit after tax 60 44.7 million (51.7) 50 40 30 20 15.9 5.6 (4.5) 10 (3.3) 4.6 0 -10 -20 1…
FY15 Operating cash flow reconciliation Strong funding position with 129 million liquidity Movement in opening and closing cash balance 250 million 200 115.9 (55.9) 129 million (25.4) total liquidity 150 111.2 76.6 (58.7)…
2P oil and gas reserves Significant improvement in 2P gas reserves Movement in 2P reserves 224% organic three-year 2P oil and gas reserves 120.0 replacement ratio mmboe 100.0 56.5 (2.0) 0.2 94.6 Proved plus probable (2P)…
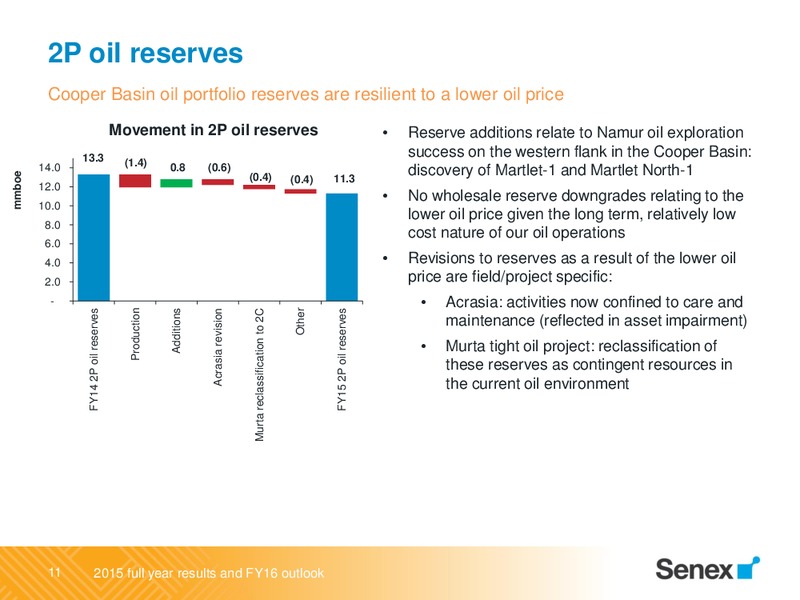
2P oil reserves Cooper Basin oil portfolio reserves are resilient to a lower oil price Movement in 2P oil reserves Reserve additions relate to Namur oil exploration 13.3 success on the western flank in the Cooper Basin: 14.0 (1.4)…
Ian Davies Managing Director and CEO Summary of FY15 results FY16 outlook Key takeaways 12 2015 full year results and FY16 outlook
Senex corporate strategy 13 2015 full year results and FY16 outlook
Strength in a lower oil price environment Preparing for a possible downside oil price scenario (lower for longer) Gas business growth provides diversification of Brent oil price forward curve revenue stream 110 110 US/bbl…
FY16 business priorities Disciplined approach to capital allocation whilst retaining growth options Maintaining financial strength through ongoing oil production and reduced work programs Continuing to drive growth projects in Senexs…
FY16 guidance Reflects FY16 business priorities Production FY16 forecast production: 1.5 1.0 1.2 Impacted by reduced capital expenditure in FY15 mmboe 1.38 1.39 and FY16 1.25 1 Reflects natural field decline on base portfolio…
Cooper Basin FY16 work program A self-funding, focused work program 15 20 million to be deployed across a production focused program: Minimum of two oil prospects to be drilled in H1, with several additional wells planned for H2…
Western Surat Gas Project FY16 work program Delivering an economic business case for WSGP 20 25 million to be deployed across the following activities: Pilot programs commissioned (well completions on existing wells, and construction…
Summary FY16 work program Disciplined approach to capital allocation whilst retaining growth options Surat Basin Gas Western Surat Project Optimised capital outlay to progress project to FID Cooper Basin oil Cooper oil exploration…
Ian Davies Managing Director and CEO Summary of FY15 results FY16 outlook Key takeaways 20 2015 full year results and FY16 outlook
Key takeaways Growth focused exploration and production company FY15 Solid production of 1.39 mmboe in line with guidance, with healthy margins maintained Important strategic milestones reached in the establishment of Senexs gas…
Registered Office Level 14, 144 Edward Street GPO Box 2233 Brisbane, Queensland 4000 Australia Telephone +61 7 3335 9000 Web www.senexenergy.com.au 2015 full year results and FY16 outlook
Appendix FY15 corporate scorecard Delivery against revised guidance Original Revised FY15 Safety Comment guidance guidance result TRIFR - - 6.24 Improvement versus FY14 (6.46) Operational 3D seismic 1,000 km2 800 km2 800 km2…
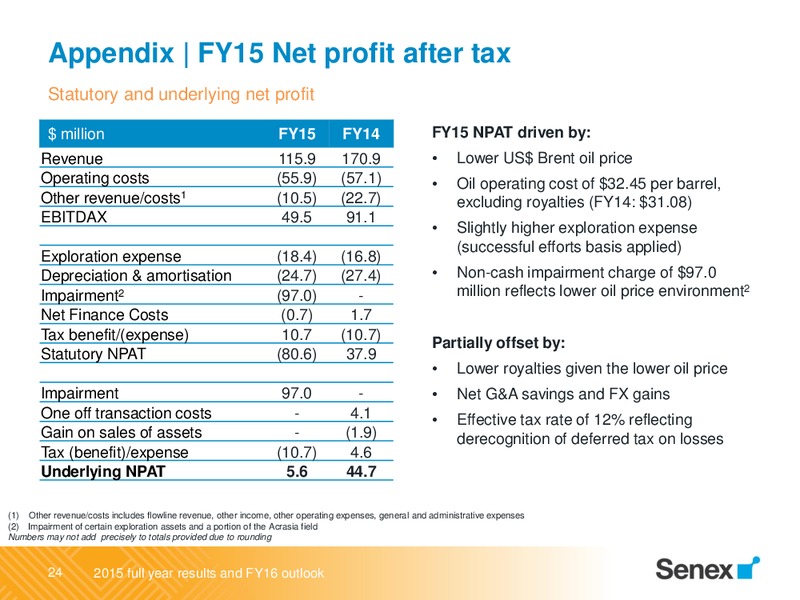
Appendix FY15 Net profit after tax Statutory and underlying net profit million FY15 FY14 FY15 NPAT driven by: Revenue 115.9 170.9 Lower US Brent oil price Operating costs (55.9) (57.1) Oil operating cost of 32.45 per barrel, Other…
Appendix EBITDAX and G&A EBITDAX reconciliation G&A reconciliation FY15 FY14 FY15 FY14 Saving million million Statutory net profit (loss) after tax (80.6) 37.9 Net G&A 9.7 25.5 15.9 Add/(less): Add/(less): Net interest 0.7 (1.7) Tax…
Appendix Reserves and resources Revision to Acquisition 30 June 2014 Production previous & 30 June 2015 % change estimates & divestments yoy additions Reserves 1P 5.5 (1.39) 0.2 0.0 4.3 (22%) 2P 39.9 (1.39) (2.6) 58.7 94.6 137%…
 Loading...