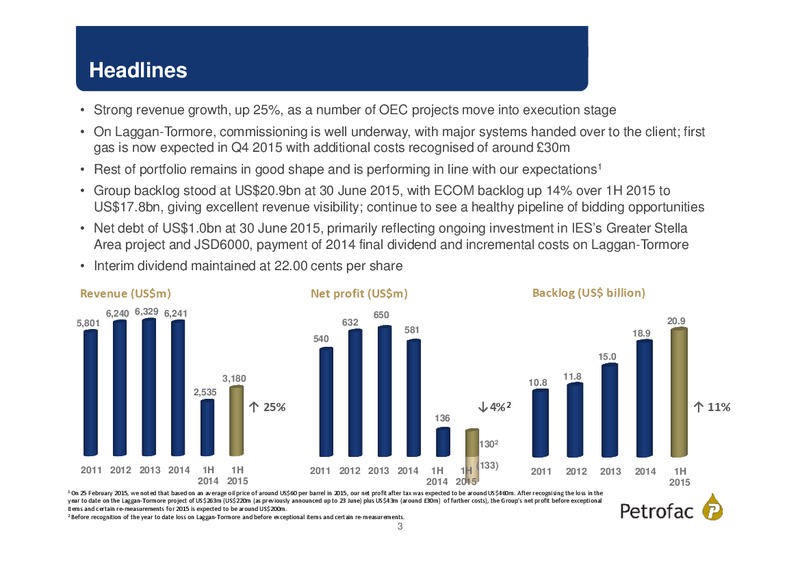
Headlines Strong revenue growth, up 25%, as a number of OEC projects move into execution stage On Laggan-Tormore, commissioning is well underway, with major systems handed over to the client; first gas is now expected in Q4 2015 with…
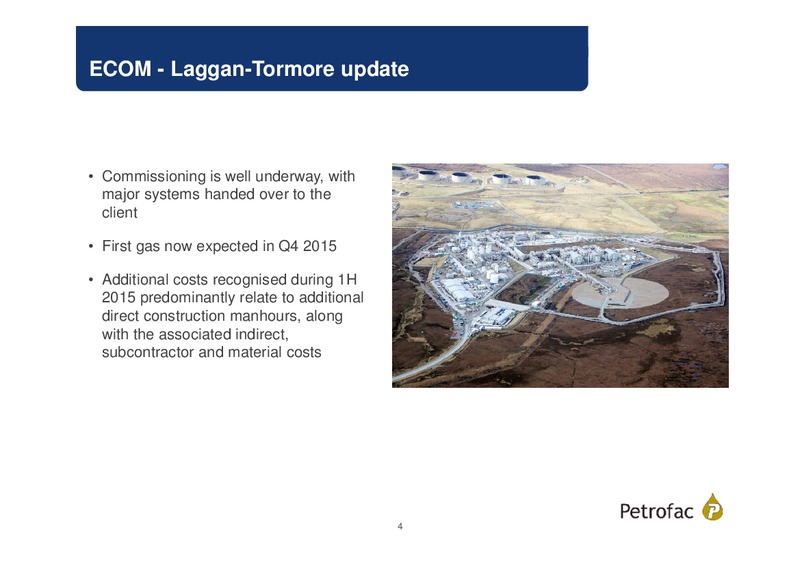
ECOM - Laggan-Tormore update Commissioning is well underway, with major systems handed over to the client First gas now expected in Q4 2015 Additional costs recognised during 1H 2015 predominantly relate to additional direct…
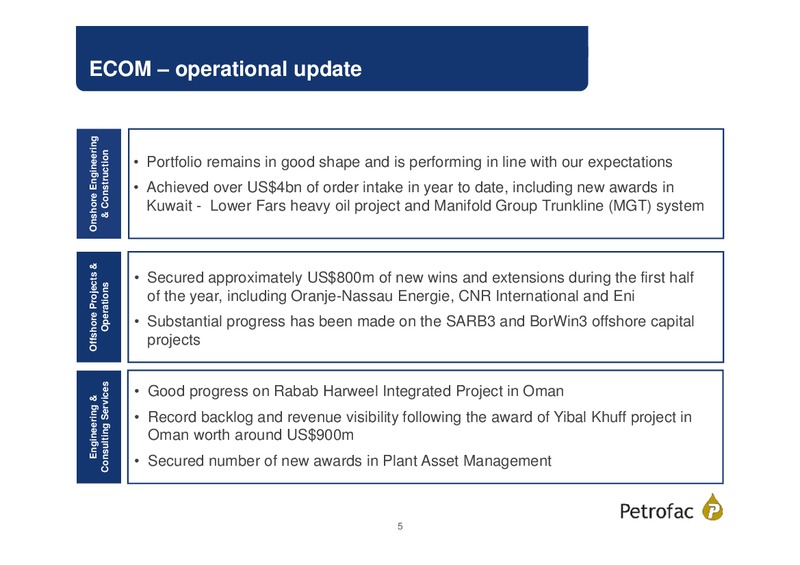
ECOM operational update Onshore Engineering & Construction Portfolio remains in good shape and is performing in line with our expectations Achieved over US4bn of order intake in year to date, including new awards in Kuwait - Lower…
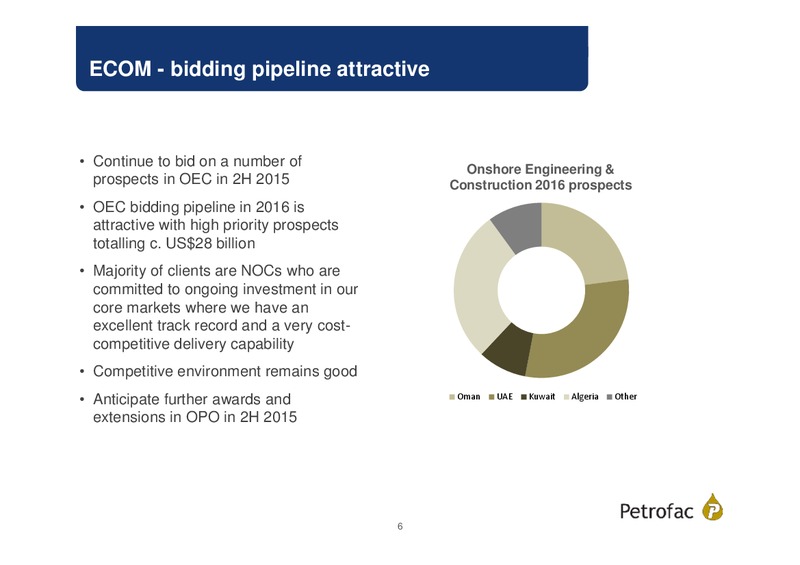
ECOM - bidding pipeline attractive Continue to bid on a number of Onshore Engineering & prospects in OEC in 2H 2015 Construction 2016 prospects OEC bidding pipeline in 2016 is attractive with high priority prospects totalling c.…
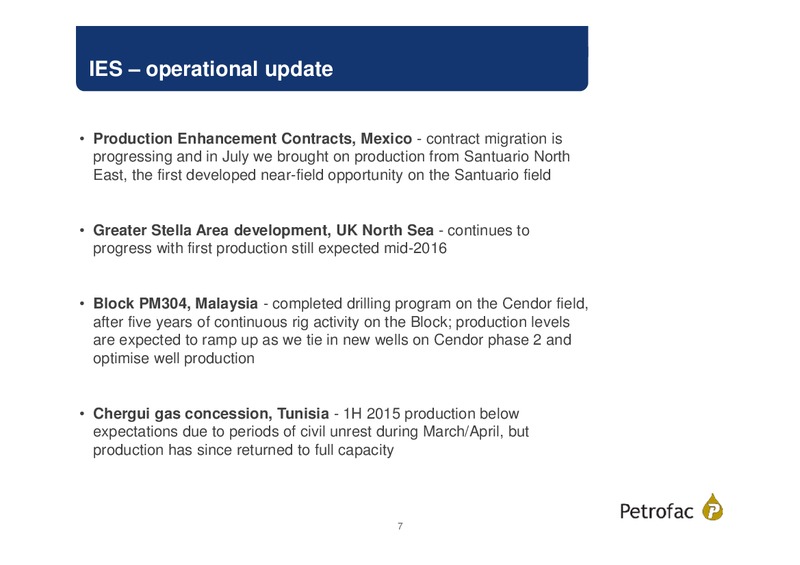
IES operational update Production Enhancement Contracts, Mexico - contract migration is progressing and in July we brought on production from Santuario North East, the first developed near-field opportunity on the Santuario field…
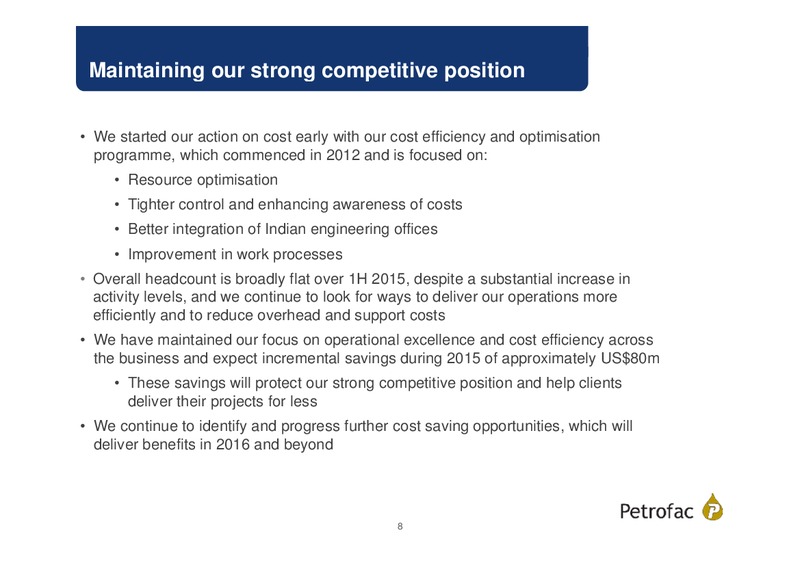
Maintaining our strong competitive position We started our action on cost early with our cost efficiency and optimisation programme, which commenced in 2012 and is focused on: Resource optimisation Tighter control and enhancing…
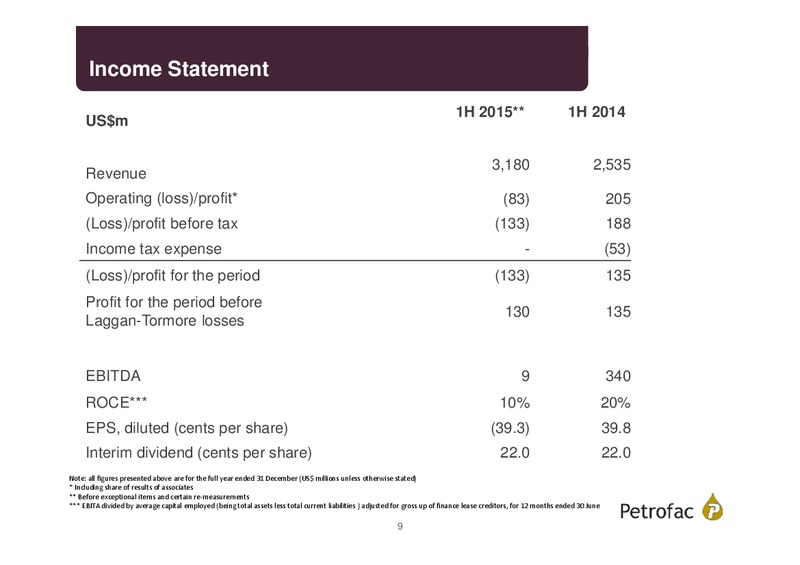
Income Statement 1H 2015** 1H 2014 USm 3,180 2,535 Revenue Operating (loss)/profit* (83) 205 (Loss)/profit before tax (133) 188 Income tax expense - (53) (Loss)/profit for the period (133) 135 Profit for the period before 130…
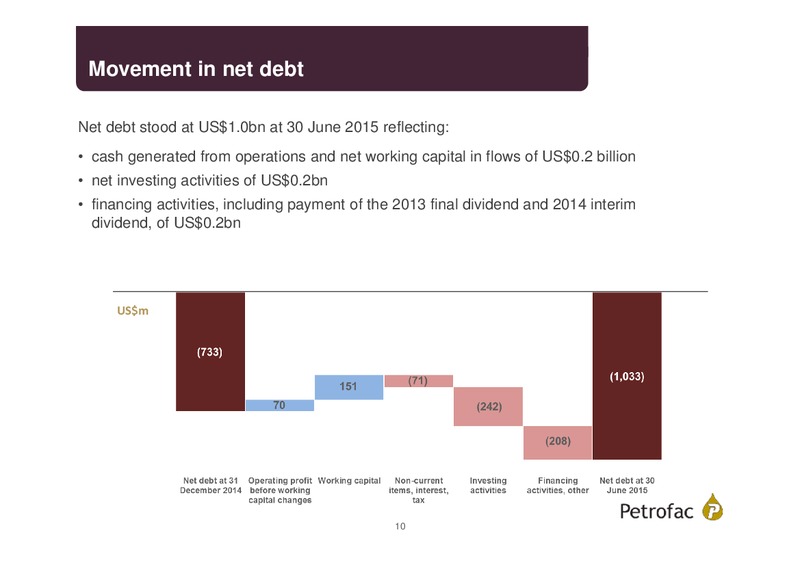
Movement in net debt Net debt stood at US1.0bn at 30 June 2015 reflecting: cash generated from operations and net working capital in flows of US0.2 billion net investing activities of US0.2bn financing activities, including payment…
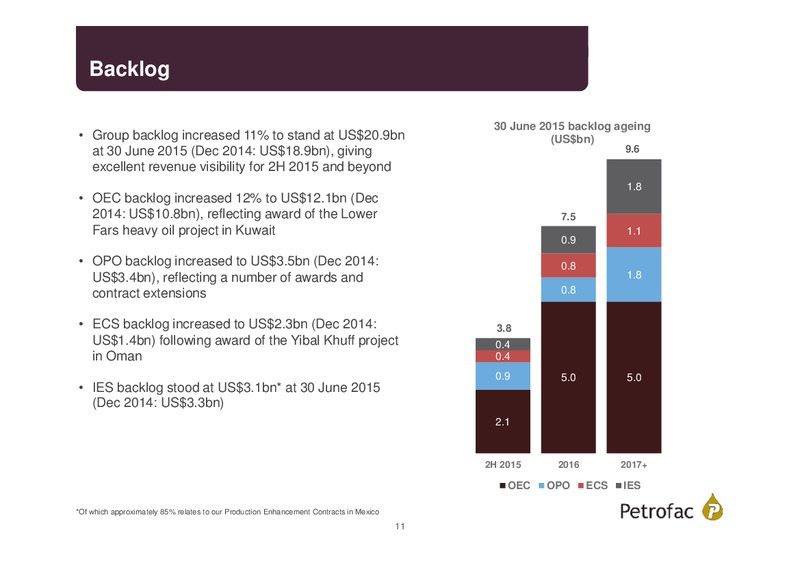
Backlog 30 June 2015 backlog ageing Group backlog increased 11% to stand at US20.9bn (USbn) at 30 June 2015 (Dec 2014: US18.9bn), giving 9.6 excellent revenue visibility for 2H 2015 and beyond 1.8 OEC backlog increased 12% to…
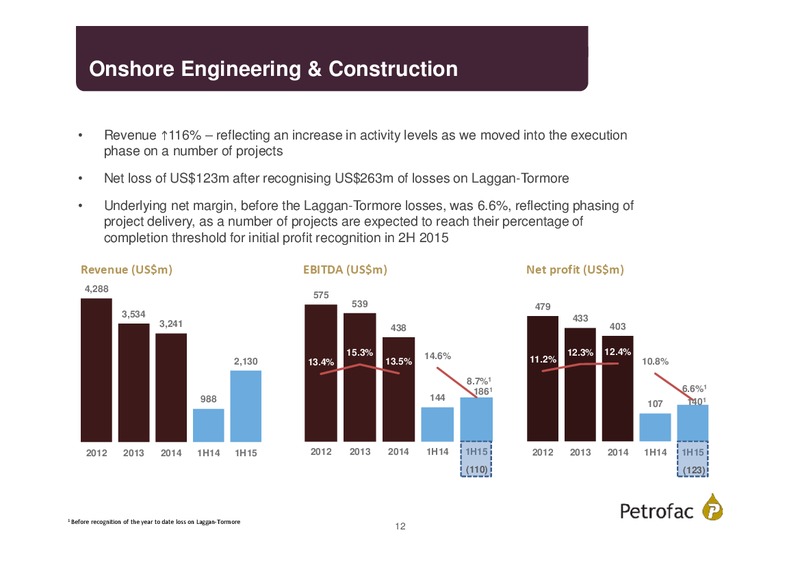
Onshore Engineering & Construction Revenue h116% reflecting an increase in activity levels as we moved into the execution phase on a number of projects Net loss of US123m after recognising US263m of losses on Laggan-Tormore…
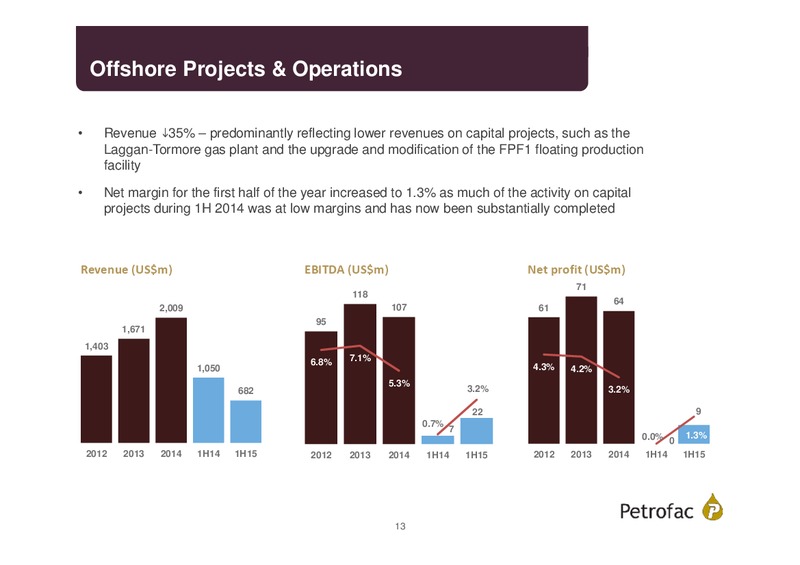
Offshore Projects & Operations Revenue i35% predominantly reflecting lower revenues on capital projects, such as the Laggan-Tormore gas plant and the upgrade and modification of the FPF1 floating production facility Net margin for…
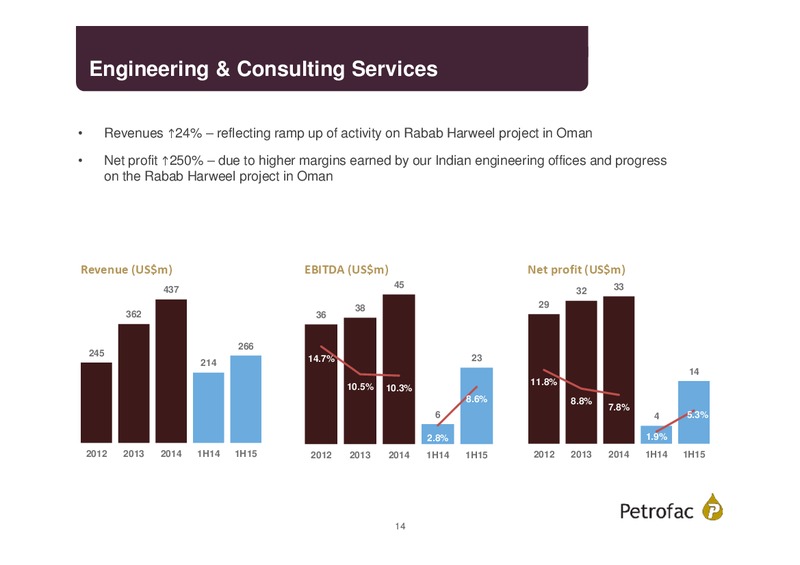
Engineering & Consulting Services Revenues h24% reflecting ramp up of activity on Rabab Harweel project in Oman Net profit h250% due to higher margins earned by our Indian engineering offices and progress on the Rabab Harweel…
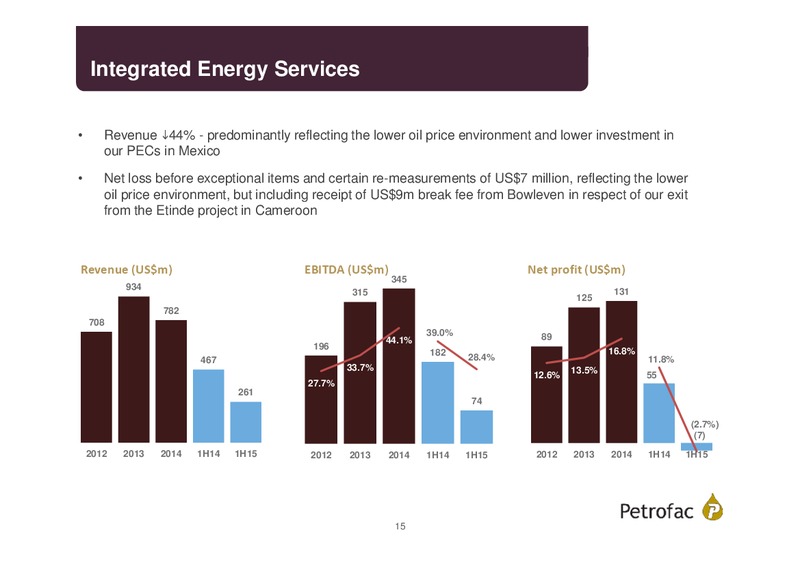
Integrated Energy Services Revenue i44% - predominantly reflecting the lower oil price environment and lower investment in our PECs in Mexico Net loss before exceptional items and certain re-measurements of US7 million, reflecting…
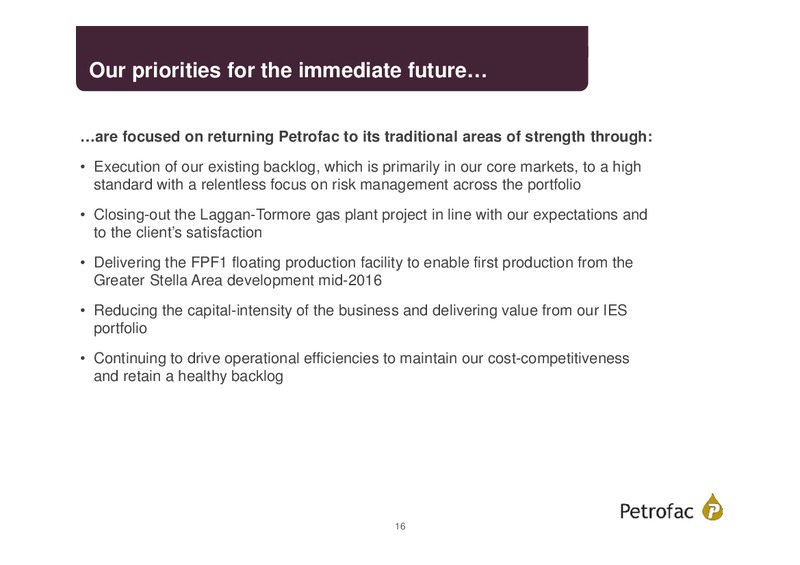
Our priorities for the immediate future are focused on returning Petrofac to its traditional areas of strength through: Execution of our existing backlog, which is primarily in our core markets, to a high standard with a relentless…
Appendices
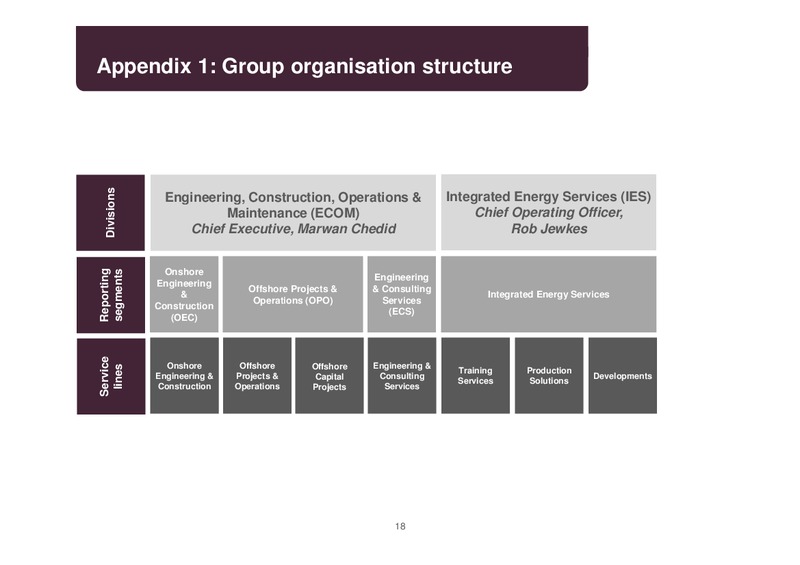
Appendix 1: Group organisation structure Divisions Engineering, Construction, Operations & Integrated Energy Services (IES) Maintenance (ECOM) Chief Operating Officer, Chief Executive, Marwan Chedid Rob Jewkes Reporting…
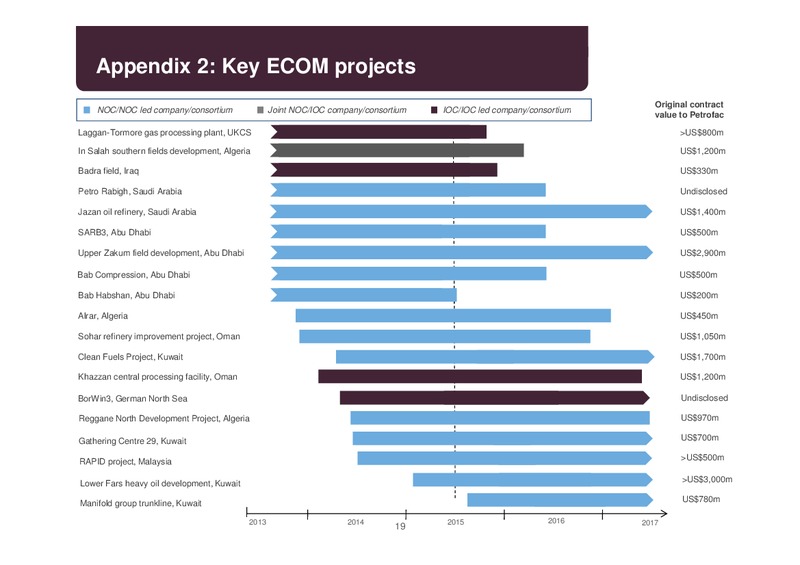
Appendix 2: Key ECOM projects Original contract NOC/NOC led company/consortium Joint NOC/IOC company/consortium IOC/IOC led company/consortium value to Petrofac Laggan-Tormore gas processing plant, UKCS US800m In Salah southern…
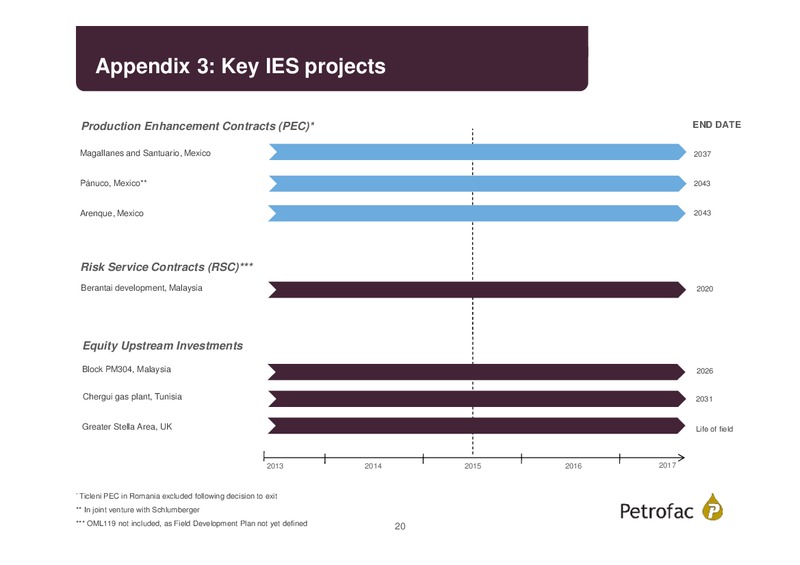
Appendix 3: Key IES projects Production Enhancement Contracts (PEC)* END DATE Magallanes and Santuario, Mexico 2037 Pnuco, Mexico** 2043 Arenque, Mexico 2043 Risk Service Contracts (RSC)*** Berantai development, Malaysia…
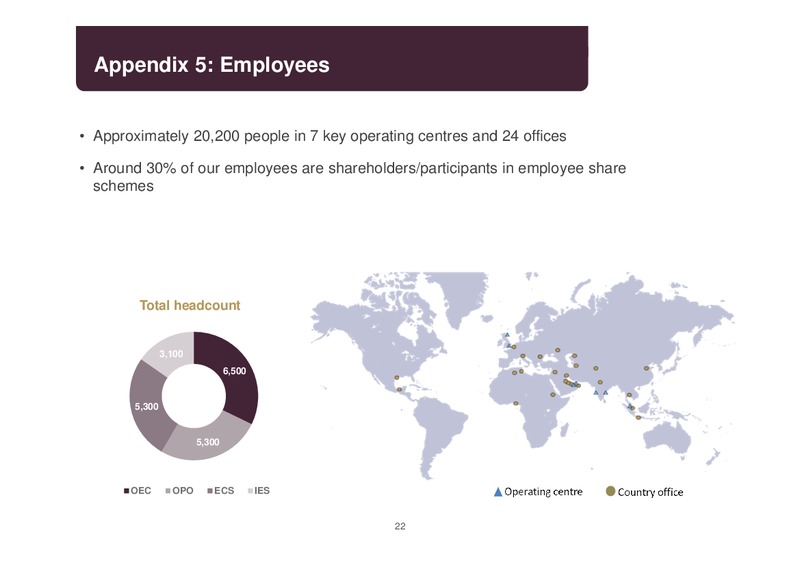
Appendix 5: Employees Approximately 20,200 people in 7 key operating centres and 24 offices Around 30% of our employees are shareholders/participants in employee share schemes Total headcount 3,100 6,500 5,300…
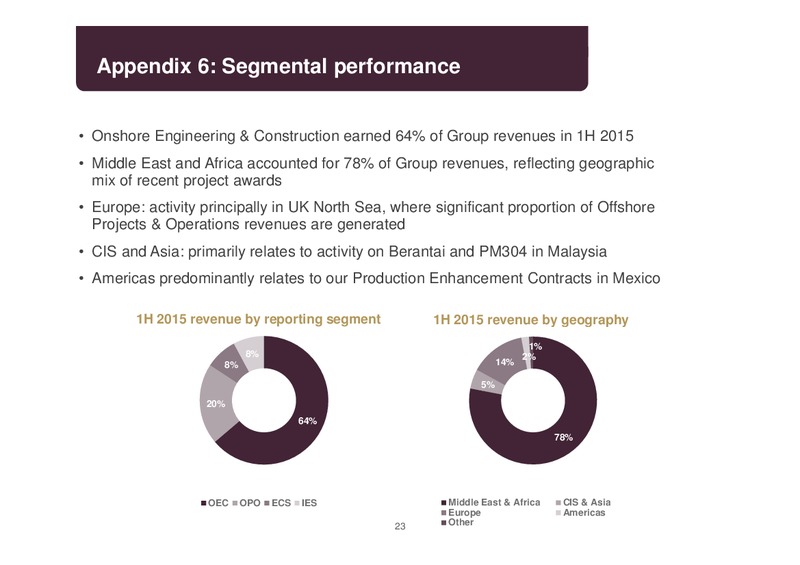
Appendix 6: Segmental performance Onshore Engineering & Construction earned 64% of Group revenues in 1H 2015 Middle East and Africa accounted for 78% of Group revenues, reflecting geographic mix of recent project awards Europe:…
 Loading...