Financial Results for 1H 2015 27 August 2015 Knots Ahead of the Rest
Q2 2015 Highlights Knots Ahead of the Rest
Key takeaways Year to date EBITDA increased by 14.6% year-on-year to RM556.5 million. Net cash flows generated from operating activities increased by 53.0% year- on-year, to RM383.1 million in the first half of 2015. Second quarter…
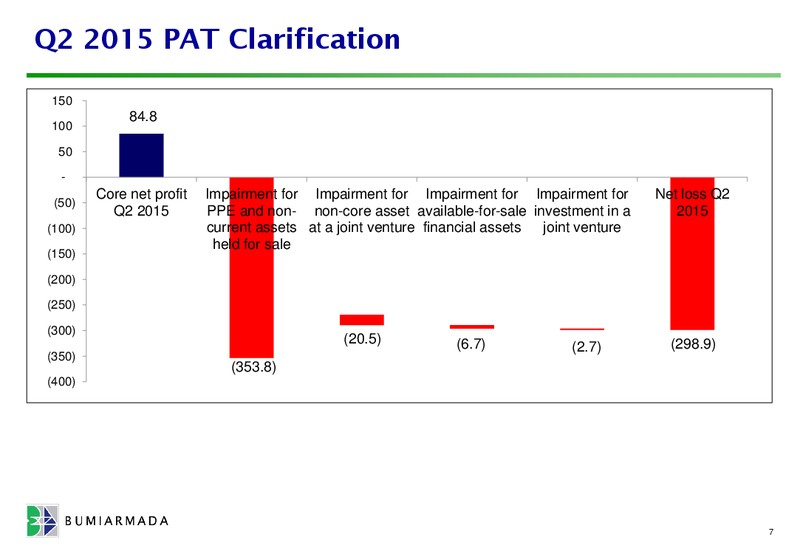
Normalised PAT RMmil Q2 2015 YTD 2015 Net loss (298.9) (225.9) Impairment - Property, plant and equipment and non-current assets held for sale 353.8 353.8 - Non-core asset at a joint venture 20.5 20.5 - Available-for-sale…
Q2 2015 PAT Clarification 150 84.8 100 50 - Core net profit Impairment for Impairment for Impairment for Impairment for Net loss Q2 (50) Q2 2015 PPE and non- non-core asset available-for-sale investment in a 2015 (100) current…
Impairment of property, plant and equipment and non-current assets held for sale Carrying Carrying amount before amount after impairment impairment Impairment RM'mil RM'mil RM'mil % Vessels for which an impairment charge was made…
Results Overview YTD 2015 vs. YTD 2014 (in RMmil) Revenue EBITDA Net Profit* -2.6% +14.6% 556.5 1,059.0 1,031.2 163.2 485.8 -234.5% YTD 2014 YTD 2015 YTD 2014 YTD 2015 YTD 2014 YTD 2015 (219.5) Net core profit (excluding…
YTD 2015 PAT Clarification 200 159.9 100 - Core net profit Impairment for Impairment for Impairment for Impairment for Net loss YTD YTD 2015 PPE and non- non-core asset at available-for-sale investment in a 2015 (100) current…
Revenue composition by segments Q2 2015 vs. Q1 2015 (in RMmil) Performance in established segments driven by the underlying activities FPSO & FGS OSV 291.1 -6.9% 164.5 271.1 -23.5% 125.9 Q1 2015 Q2 2015 Q1 2015 Q2 2015 Lower…
Revenue composition by segments YTD 2015 vs. YTD 2014 (in RMmil) Performance in established segments driven by the underlying activities FPSO & FGS OSV 562.2 -6.1% +31.6% 309.2 290.4 427.1 YTD 2014 YTD 2015 YTD 2014 YTD 2015…
Revenue composition by geographical % Malaysia based international company continued expansion across key regions YTD 2014 YTD 2015 5% 13% 7% 11% 26% 27% 56% 55%
Order book as at 30 June 2015 Quality firm order book increases to RM25.8 bn (Q1: RM25.6 bn) As at 30 June 2015, the Groups order book stood at RM25.8 bn compared to RM25.6 bn as at 31 March 2015. Upon expiration of the firm contract…
Updates & Outlook Knots Ahead of the Rest
Project Updates Armada Kraken (North Sea, UK) Status: 60% completed Expected Completion: Q3 2016 Armada Kraken: M40 Module Armada Olombendo (Angola 15/06) Status: 50% completed Expected Completion: Q4 2016 Armada Kraken:…
Project Updates Armada Madura (Indonesia) Status: 20% completed Expected Completion: Q4 2016 Armada Madura: First Steel Cut Malta LNG FSU Status: 10% completed Expected Completion: Q2 2016 Armada Madura: Main Deck Overview…
In Summary The O&G sector is expected to remain challenging into 2016. The non-cash impairment was predominantly on OSV and T&I assets and reflects their current recoverable value. Core net profit without the impairment, would have…
 Loading...