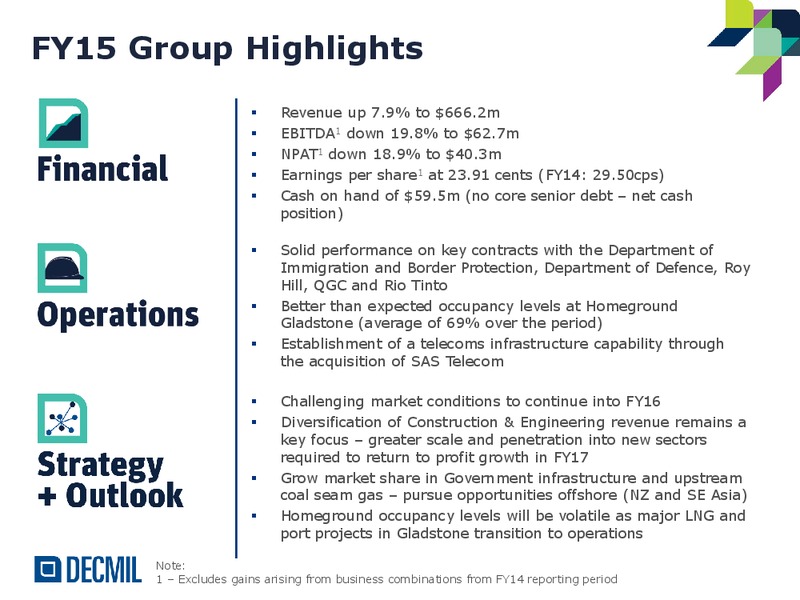
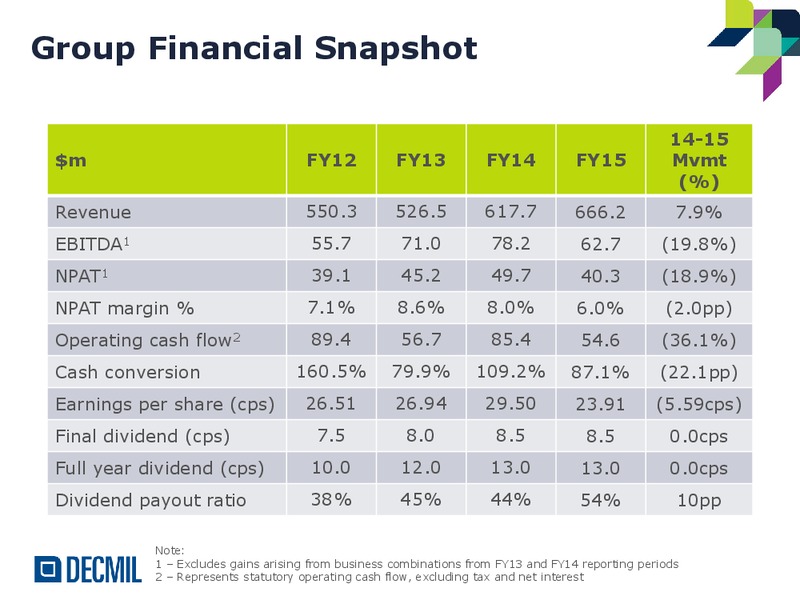
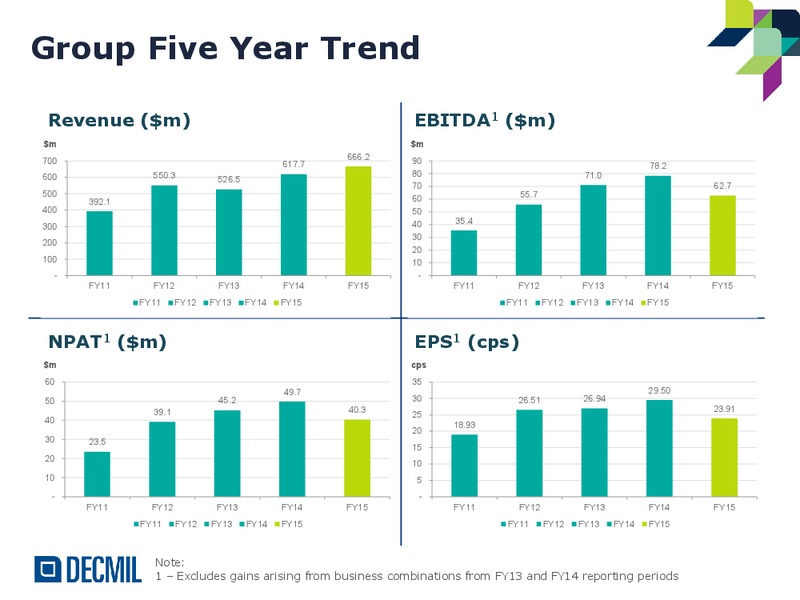
FY15 Group Highlights Revenue up 7.9% to 666.2m EBITDA1 down 19.8% to 62.7m NPAT1 down 18.9% to 40.3m Earnings per share1 at 23.91 cents (FY14: 29.50cps) Cash on hand of 59.5m (no core senior debt net cash position) Solid…
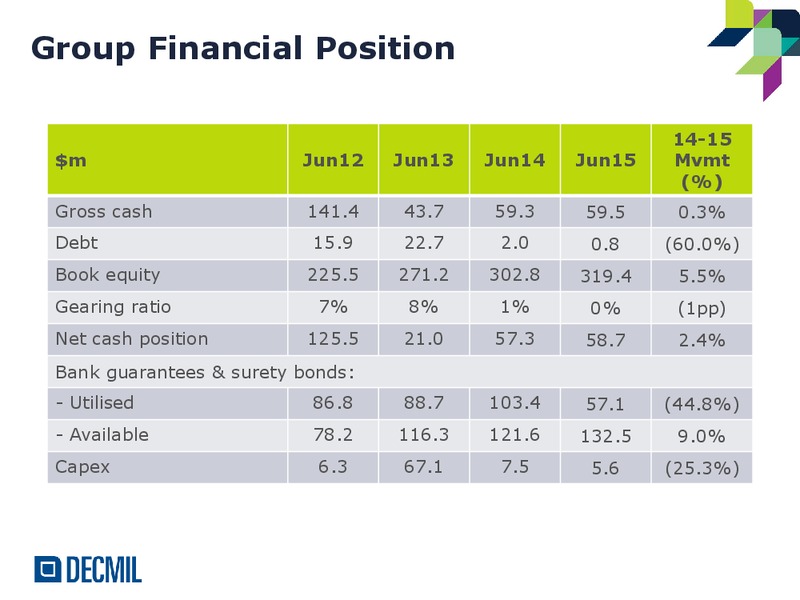
Group Financial Position 14-15 m Jun12 Jun13 Jun14 Jun15 Mvmt (%) Gross cash 141.4 43.7 59.3 59.5 0.3% Debt 15.9 22.7 2.0 0.8 (60.0%) Book equity 225.5 271.2 302.8 319.4 5.5% Gearing ratio 7% 8% 1% 0% (1pp) Net cash position…
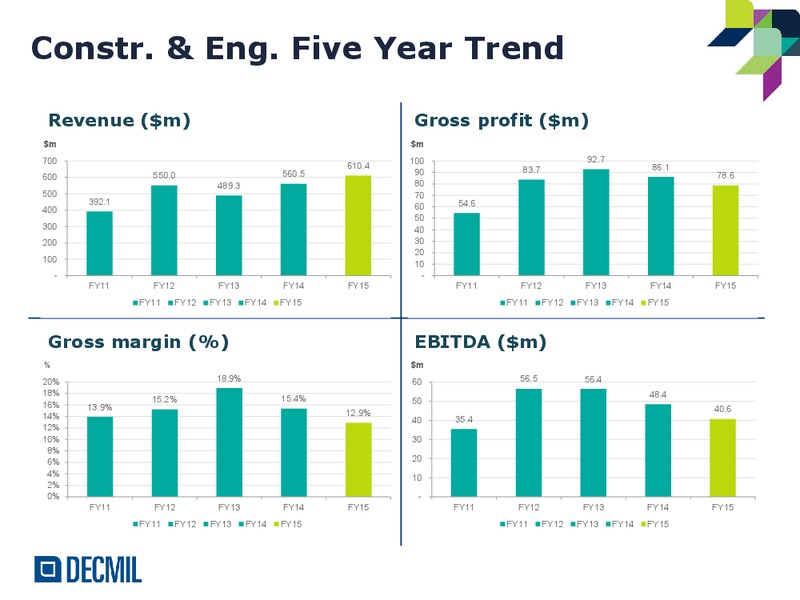
Group Five Year Trend Revenue (m) EBITDA1 (m) m m 700 666.2 90 617.7 78.2 600 550.3 80 71.0 526.5 70 62.7 500 55.7 392.1 60 400 50 40 35.4 300 30 200 20 100 10 - - FY11 FY12 FY13 FY14 FY15 FY11 FY12 FY13 FY14 FY15 FY11 FY12…
Construction & Engineering
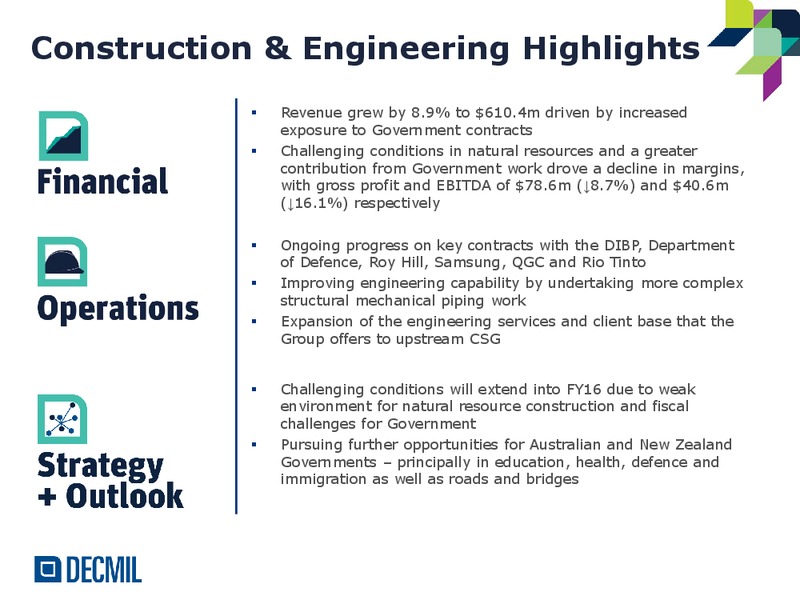
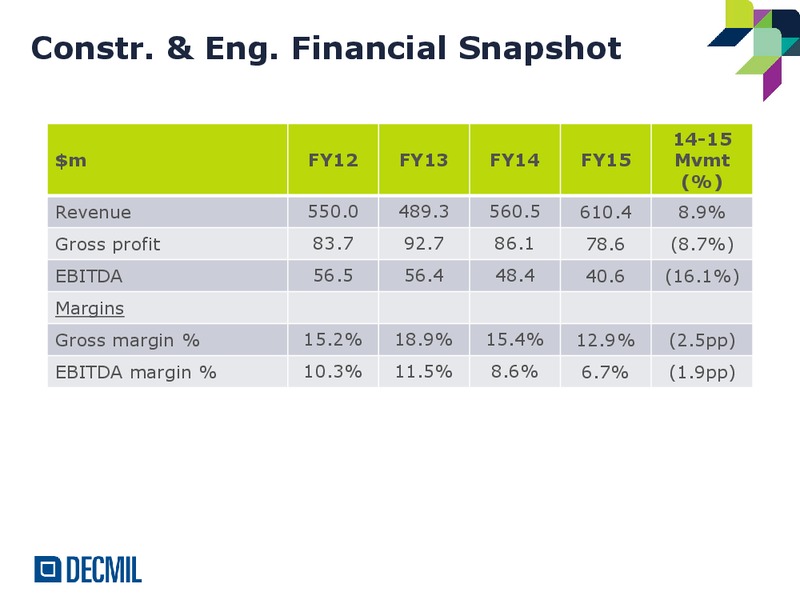
Construction & Engineering Highlights Revenue grew by 8.9% to 610.4m driven by increased exposure to Government contracts Financial Challenging conditions in natural resources and a greater contribution from Government work drove a…
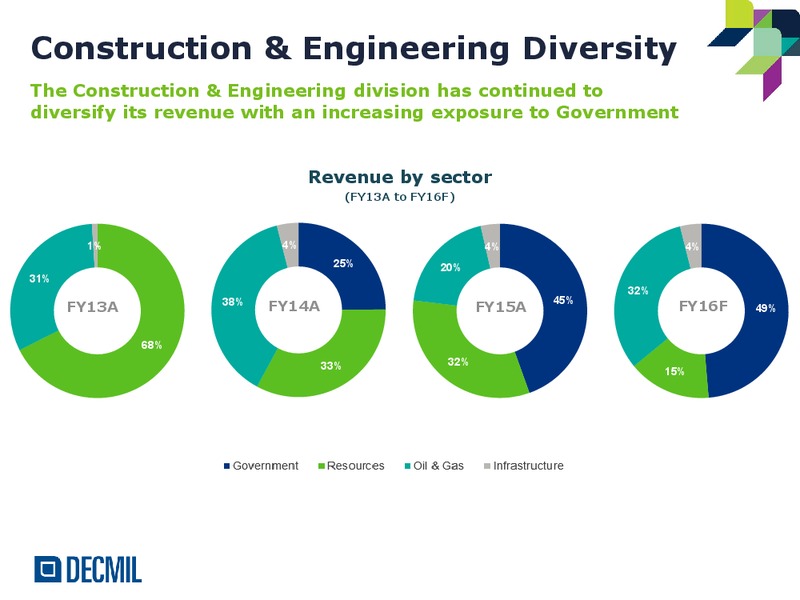
Construction & Engineering Diversity The Construction & Engineering division has continued to diversify its revenue with an increasing exposure to Government Revenue by sector (FY13A to FY16F) - 1% 4% 4% 4% 25% 20% 31% 32% 38%…
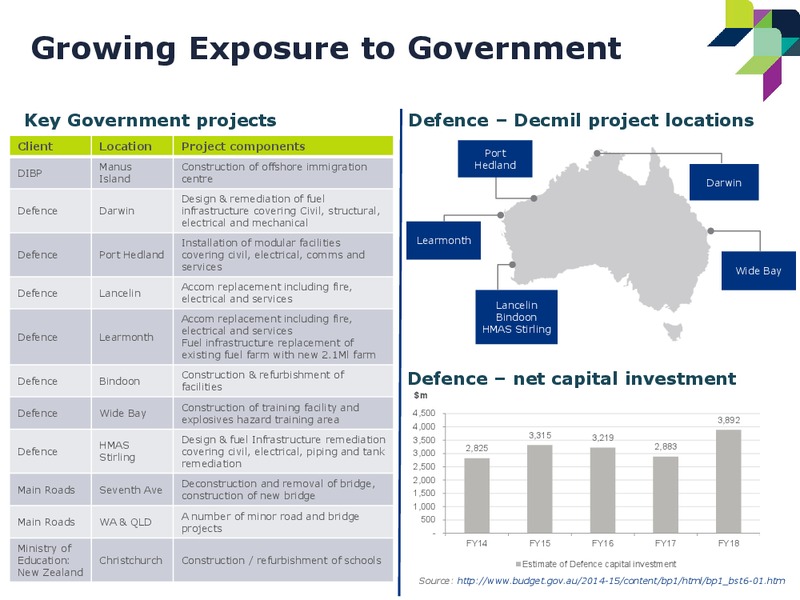
Growing Exposure to Government Key Government projects Defence Decmil project locations Client Location Project components Port Manus Construction of offshore immigration Hedland DIBP Island centre Darwin Design & remediation of…
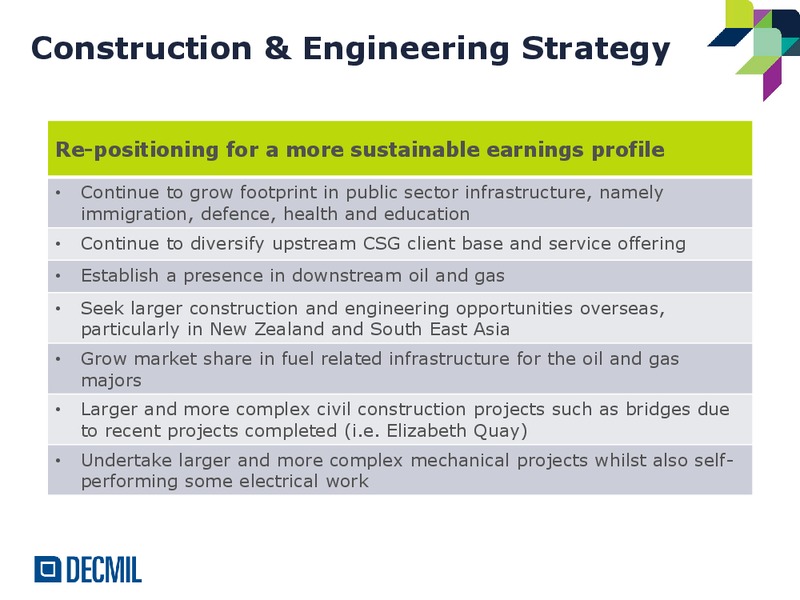
Construction & Engineering Strategy Re-positioning for a more sustainable earnings profile Continue to grow footprint in public sector infrastructure, namely immigration, defence, health and education Continue to diversify upstream…
Accommodation Services
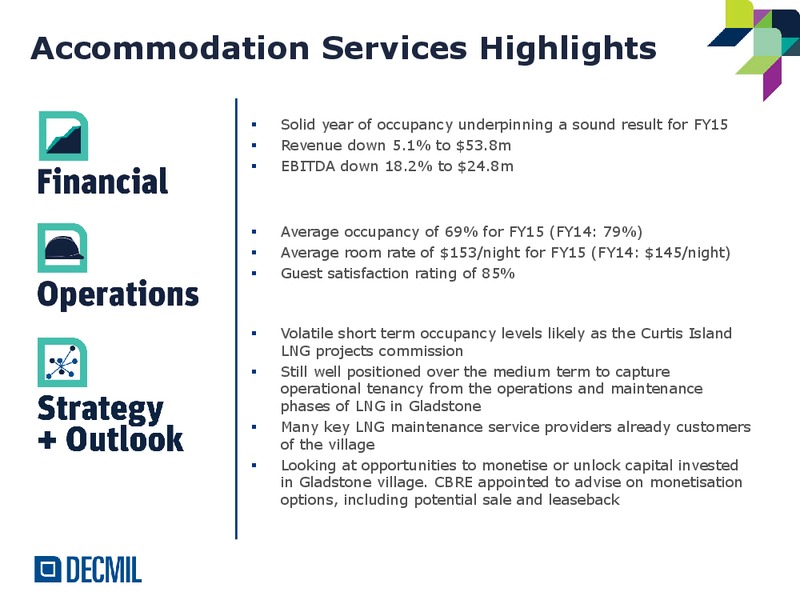
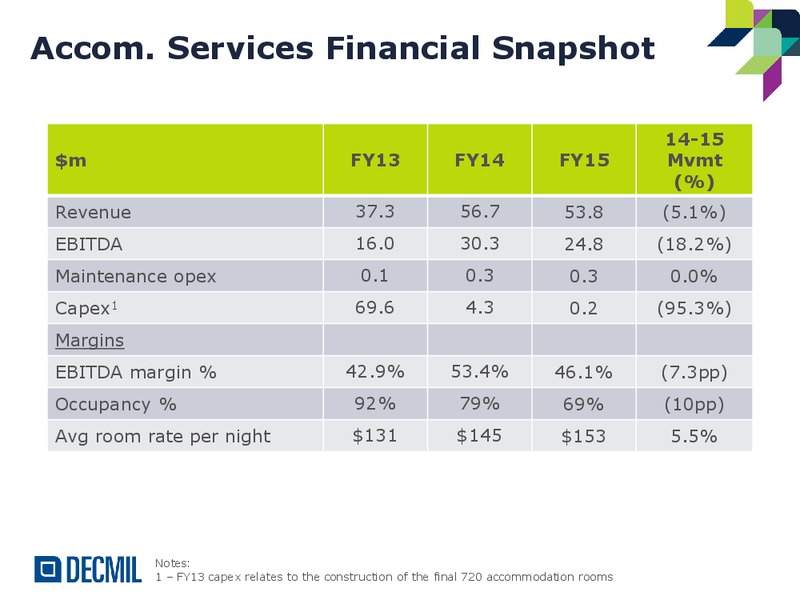
Accommodation Services Highlights Solid year of occupancy underpinning a sound result for FY15 Revenue down 5.1% to 53.8m Financial EBITDA down 18.2% to 24.8m Average occupancy of 69% for FY15 (FY14: 79%) Average room rate of…
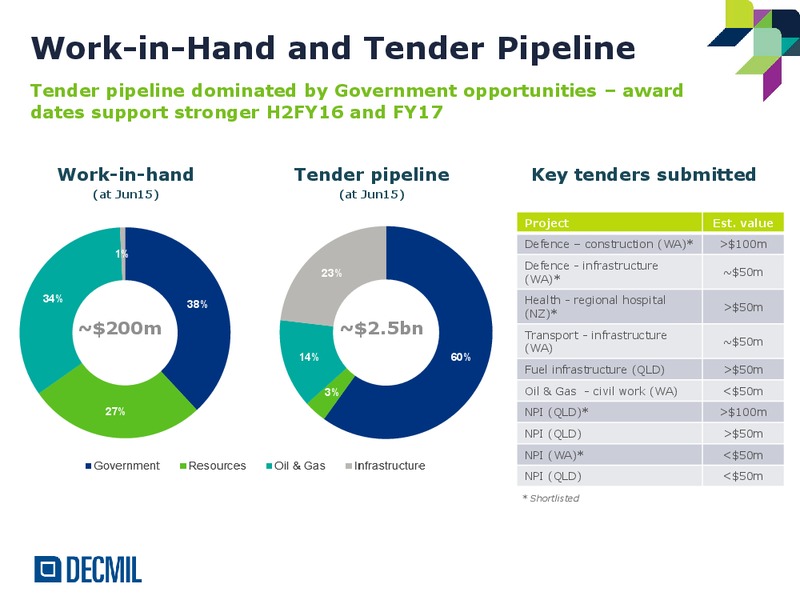
Work-in-Hand and Tender Pipeline Tender pipeline dominated by Government opportunities award dates support stronger H2FY16 and FY17 Work-in-hand Tender pipeline Key tenders submitted (at Jun15) (at Jun15) Project Est. value Defence…
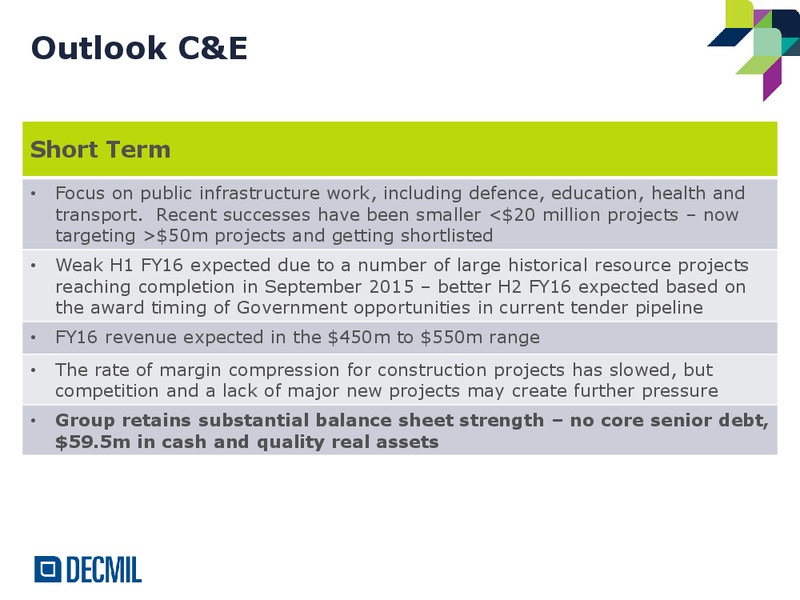
Outlook C&E Short Term Focus on public infrastructure work, including defence, education, health and transport. Recent successes have been…
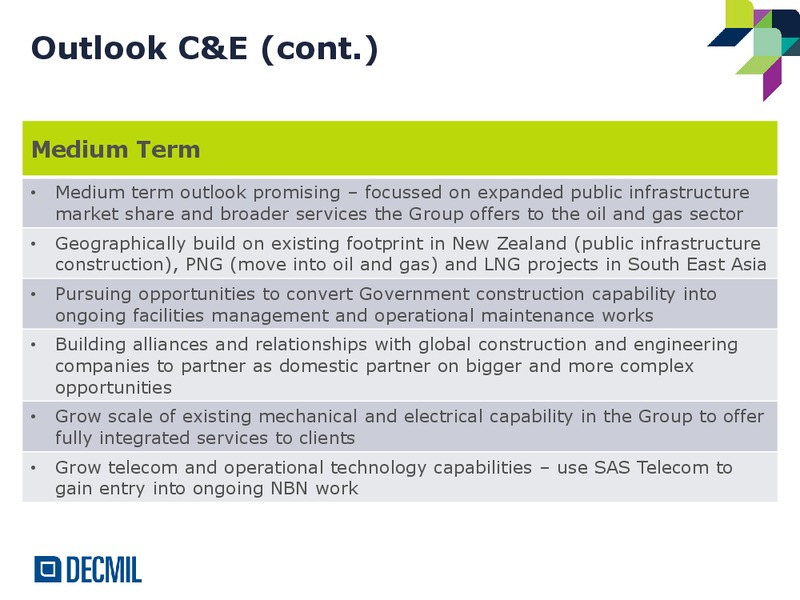
Outlook C&E (cont.) Medium Term Medium term outlook promising focussed on expanded public infrastructure market share and broader services the Group offers to the oil and gas sector Geographically build on existing footprint in New…
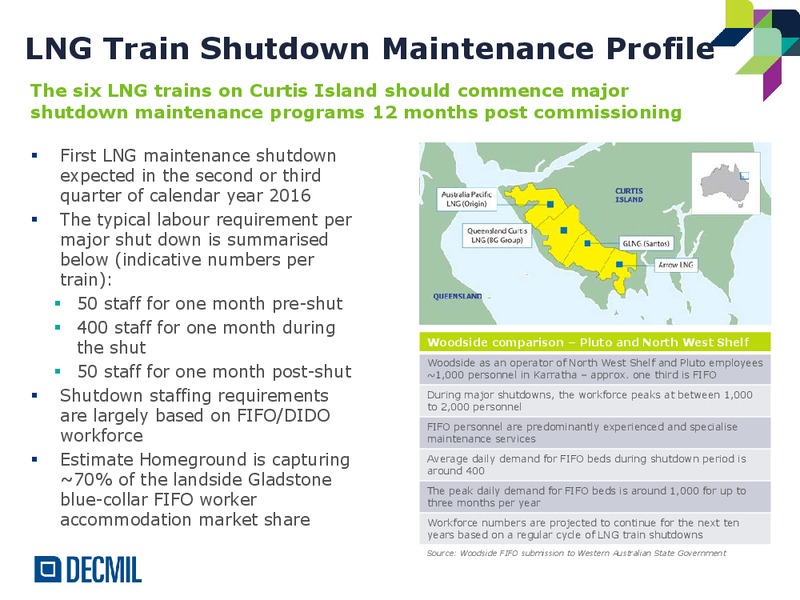
LNG Train Shutdown Maintenance Profile The six LNG trains on Curtis Island should commence major shutdown maintenance programs 12 months post commissioning First LNG maintenance shutdown expected in the second or third quarter of…
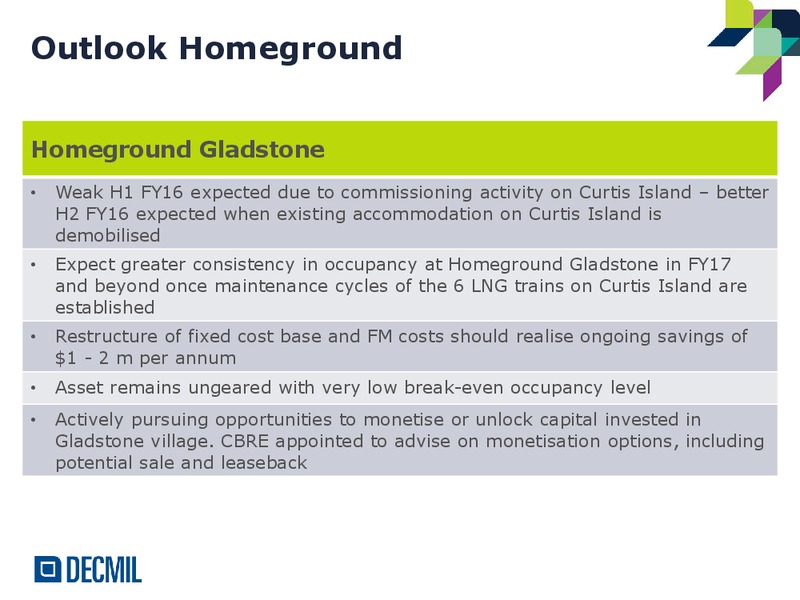
Outlook Homeground Homeground Gladstone Weak H1 FY16 expected due to commissioning activity on Curtis Island better H2 FY16 expected when existing accommodation on Curtis Island is demobilised Expect greater consistency in occupancy…
 Loading...