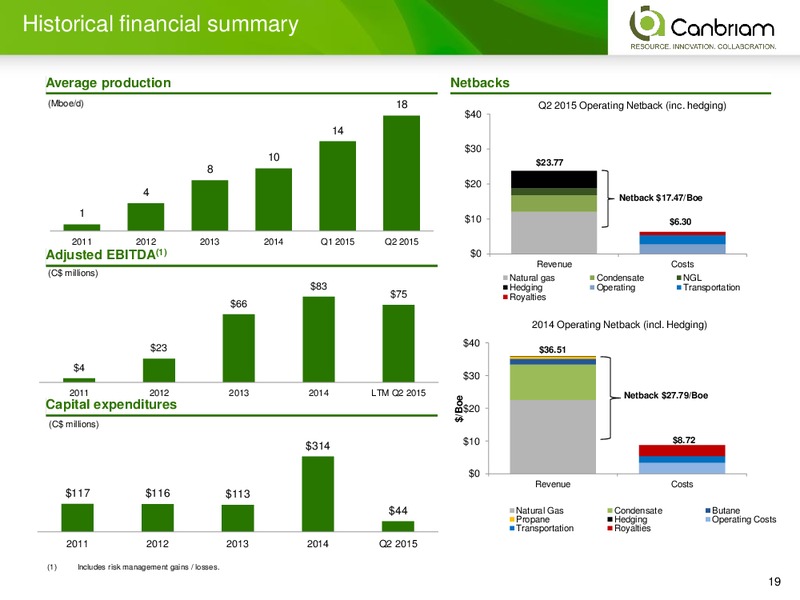
Canbriam Energy: corporate overview Overview Asset map Private company started in 2007 and focused on the prolific Montney formation in Northeast BC Q2 2015 average production of 17,753 boe/d (17% liquids) February 2015 processing…
Experienced Management team has a track record of value creation Years Deep industry experience Paul Myers 25+ President, CEO Robert Froese 25+ Chief Financial Officer Gary Gardiner 30+ Chief Operating Officer John Nieto…
Montney: significant well density & offset peer activity Petronas/Progress -Town 30 km Montney Wells Canbriam Energy Montney Shell trend Fort St. John Progress/Petronas ARC Edmonton Encana Calgary CNRL Vancouver…
Canbriam: unique geology within prolific Montney resource 4 key attributes of Canbriams Montney asset 1 Significant thickness 2 High liquids content Could ultimately result in 4 commercial 2015E liquids yield: 30 - 40 bbls/MMcf…
Canbriam: unique geology within prolific Montney resource 4 key attributes of Canbriams Montney asset (contd) 3 Over-pressured reservoir 4 Subsurface compartmentalization Results in higher OGIP & EUR Leads to distinct high-pressure…
Large drilling inventory supports low-risk production growth Well inventory (net) +34 years of upside 18 years of economic drilling inventory 36 wells / year drilling inventory 936 1622 686 186 318 686 107 40 35…
Stable production history with strong liquids content 140 Inlet Sep Capacity 120 100 Natural Gas 80 mmcf/d 60 40 20 Sept-14: Plant turnaround 0 3,500 80 3,000 70 60 2,500 Yield bbls/MMcf 50 2,000…
Development plan focused in the prolific Main Fault Block Development wells: 23 wells (June 30, 2015) Targeting 2 Upper & 1 Lower Montney zones within Main Fault Block Utilizing limited-entry, slickwater completions 23 wells…
Main Fault Block type well economic sensitivities Montney NPV10 (M) including hedge positions Montney IRR including hedge positions 18,000 100% 16,000 90% 80% 14,000 70% 12,000 60% 10,000 50% 8,000 40% 6,000 30% 4,000…
Downhole chokes have improved decline rates Advantages of using downhole chokes Altares c-B27-H well - Upper Montney 15.0 30,000 Manages 1st year production declines and 14.0 28,000 fosters stable production 13.0 26,000 Enhances…
Illustrative well economics - Upper Montney Illustrative well economics Canbriam development well vs. type curve Main Fault Block (MFB) Upper Montney Drilling locations(1) 284 6,000 Well properties Raw gas type curve (Bcf)(2)…
Illustrative well economics - Lower Montney Illustrative well economics Canbriam development well vs. type curve Main Fault Block (MFB) Lower Montney Drilling locations(1) 149 6,000 Well properties 5,000 2 Lower Montney wells…
Infrastructure strategy supports large scale development 100% owned and operated infrastructure North Altares facilities Newly commissioned Altares Processing Facility consists of b-72-A gas processing facility and c-62-A water…
Altares Processing Facility: scalable to 400 MMcf/d Water treatment & recycling hub Commissioned March 2015 Phase 4: 120 MMcf/d Sanctioning to be determined Phase 3: 120 MMcf/d Sanctioning decision in 2015 Phase 2: 80 MMcf/d…
Integrated water solution is a strategic advantage Sourcing Canbriam - Altares 20-year permit to access up to 10,000 m3/day of low- cost fresh water from Williston Lake Permitted fresh water supports 1 Bcf/d production Includes…
Operating environment supports development plan Spectra T North Attractive fiscal regime in BC Gas transmission Drilling credits & minimal retention drilling Mile post 73 NGL required terminal Supportive First Nations Favorable…
Hedge positions & composition of total liquids production Natural gas hedges (at June 30, 2015) Liquids hedges (at June 30, 2015) M Gj/d M Gj/d bbls/d 100 5.00 20 1.00 3,500 120.00 96.28 97.35 3,000 80 3.26 4.00 79.40 3.09 3.02…
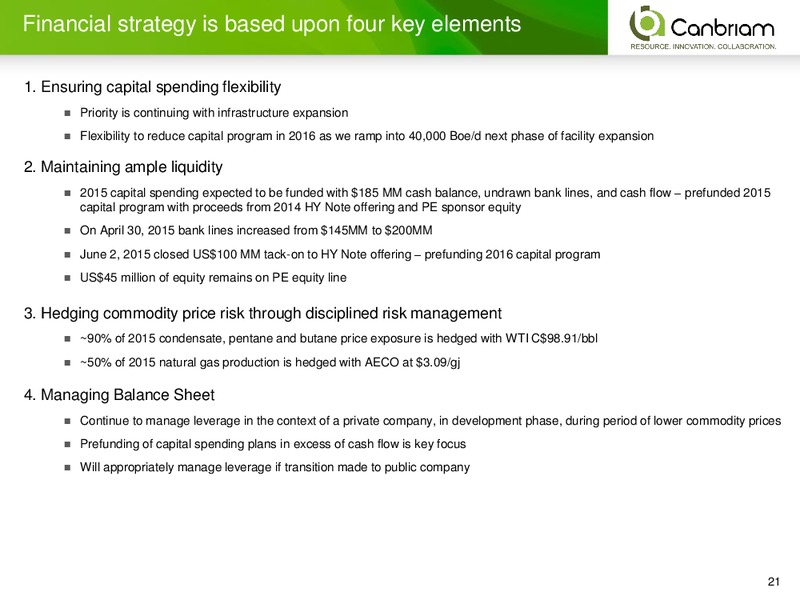
Financial strategy is based upon four key elements 1. Ensuring capital spending flexibility Priority is continuing with infrastructure expansion Flexibility to reduce capital program in 2016 as we ramp into 40,000 Boe/d next phase of…
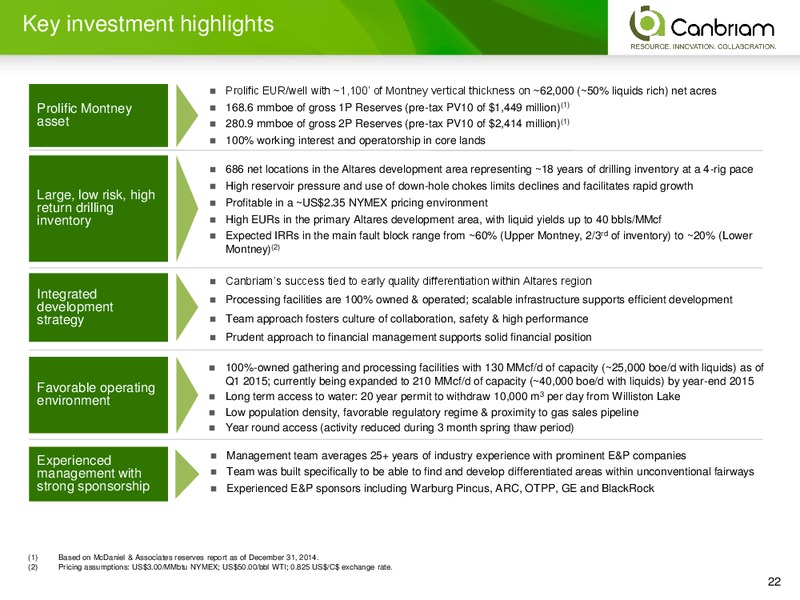
Key investment highlights Prolific EUR/well with 1,100 of Montney vertical thickness on 62,000 (50% liquids rich) net acres Prolific Montney 168.6 mmboe of gross 1P Reserves (pre-tax PV10 of 1,449 million)(1) asset 280.9 mmboe of…
Supplemental information
Canbriams integrated development strategy Subsurface & operations Infrastructure Management Canbriams success tied to Processing facilities are 100% Team approach fosters culture early quality differentiation owned & operated of…
Strategies to enhance operational performance 1 Small footprint 3 Limited entry slickwater frac completions Pad drilling minimizes surface Surface disturbance and lowers D&C Surface Casing Isolation Perf costs per well - Pump-…
Supplemental reserves information Reserves Reconciliation (1) Proved Probable Proved + Probable Natural Gas NGLs Total Natural Gas NGLs Total Natural Gas NGLs Total Bcf MMbbls MMboe Bcf MMbbls MMboe Bcf MMbbls MMboe December 31,…
Upper Montney Main Fault Block well data Daily raw gas production by well - Upper Montney Main Fault Block Development wells b-A24-H 10,000 b-B24-H 9,000 c-23-H 8,000 c-27-H c-B27-H 7,000 b-34-H Daily Gas Rate…
 Loading...