U.S. Silica Barclays CEO Energy-Power Conference New York, NY September 10, 2015
THE U.S. SILICA STORY Industry Leader. Capitalizing on Market Dynamics. Adj. EBITDA Competitive Business growth Balance Sheet advantages model 2009-2014 38% Strong Resilient Best CAGR 3
AT A GLANCE U.S. Silica Strength in Numbers Frac sand provider in world Top 3 Market positions in ISP 1 or 2 Operating facilities 17 Tons of reserves 369M Tons sold in 2014 10.9M Earnings from non-energy, stable industrial…
THE U.S. SILICA STORY Industry Leader. Capitalizing on Market Dynamics. GOALS: 1 Differentiated business model 2015-2016 Resilient performance 2020 2 Capitalizing on market dynamics Increase scale Substantial EBITDA Growth 3…
A Differentiated Business Model 1 Unmatched scale and resources 2 Advantaged distribution Strong, sustainable competitive advantages 3 Attractive customer mix 4 Strong financial position 7
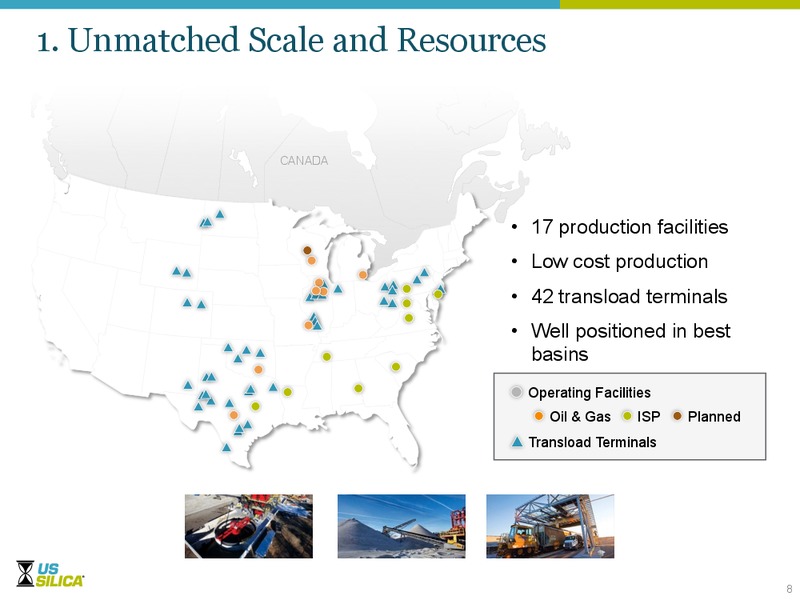
1. Unmatched Scale and Resources CANADA 17 production facilities Low cost production 42 transload terminals Well positioned in best basins Operating Facilities Oil & Gas ISP Planned Transload Terminals 8
2. Advantaged, Highly Flexible Distribution Moving Large Volumes Leverages our Highly Flexible of Proppant Supply Chain Example: Railcars and trucks needed to complete one well 430 Ability to redirect trains mid-trip Extensive…
3. Attractive Mix of Customers and Markets Oil and Gas Customers: Working with our contract customers through the downturn Oil & Gas Focused on selling more to larger, blue-chip customers Proppants Top five customers 50 year…
4. Strong Financial Position 200 M Unlevered balance sheet 46.9M available 150 Cash Flow from Ops. under revolver Total liquidity of 322M 100 as of June 30, 2015 Expect to be operating cash 50 Capex flow positive in 2015 0…
THE U.S. SILICA STORY Industry Leader. Capitalizing on Market Dynamics. GOALS: 1 Differentiated business model 2015-2016 Resilient performance 2020 2 Capitalizing on market dynamics Increase scale Substantial EBITDA Growth 3…
Responding Aggressively to Declining Demand Market Demand Down 25-30% in 2015 Average rig More sand count per well down 45% up15-20% 2014 2015E 13
Leveraging Our Speed, Scale & Strength SPEED SCALE STRENGTH Working with our supply chain Multiple mines on partners to take multiple railroads Strong balance costs out sheet More transloads Deferring rail car closer to the…
THE U.S. SILICA STORY Industry Leader. Capitalizing on Market Dynamics. GOALS: 1 Differentiated business model 2015-2016 Resilient performance 2020 2 Capitalizing on market dynamics Increase scale Substantial EBITDA Growth 3…
Key Initiatives to Drive Success 4 Consolidator accretive 3 Enhance acquisitions Industrial & Specialty performance 2 Leverage logistics to gain share in market 1 Effectively manage downturn 16
INITIATIVE 1 Effectively Manage the Downturn Capture share Partner with the right customers Laser focus on cost Focus Increase fixed cost leverage Disciplined capital spending Help drive industry consolidation Utilize our strong…
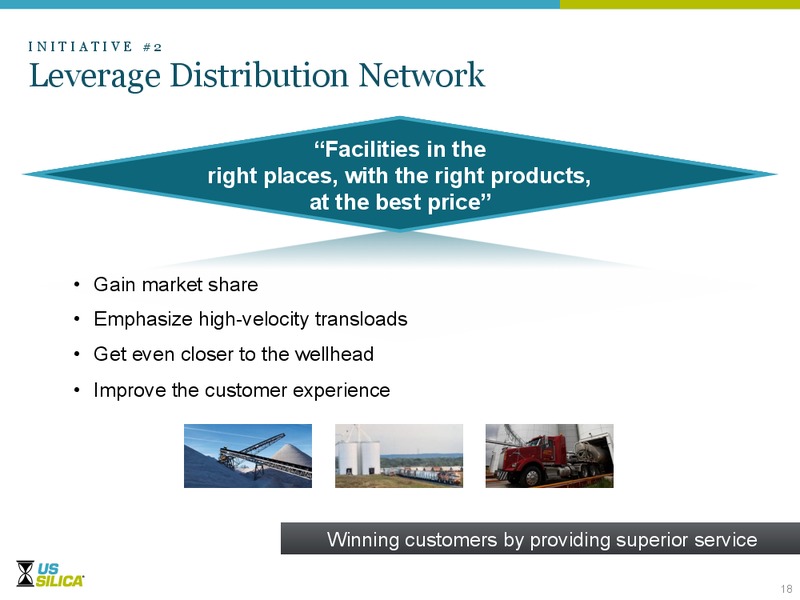
INITIATIVE 2 Leverage Distribution Network Facilities in the right places, with the right products, at the best price Gain market share Emphasize high-velocity transloads Get even closer to the wellhead Improve the customer…
INITIATIVE 3 Enhance Industrial & Specialty Performance Solid, stable cash flow business Investing in Innovation Introducing higher-margin, value 37 added specialty products to grow EBITDA Optimizing product mix On track for…
INITIATIVE 4 Grow in a Fragmented Industry Poised for Consolidation Customers are consolidating Reducing suppliers Scale matters 40 Top 10: Strong financial smaller suppliers 65% position Source: PropTester, Inc. and…
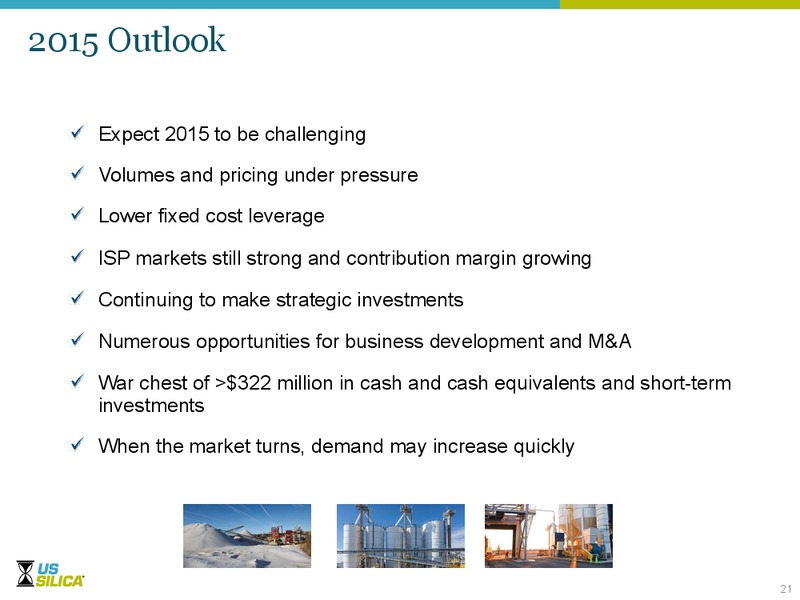
2015 Outlook Expect 2015 to be challenging Volumes and pricing under pressure Lower fixed cost leverage ISP markets still strong and contribution margin growing Continuing to make strategic investments Numerous opportunities for…
 Loading...