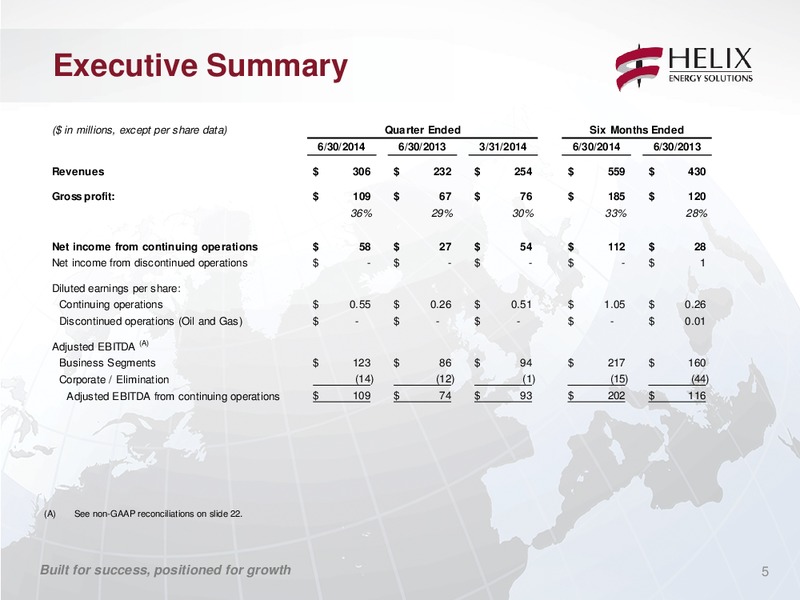
Executive Summary Q2 2014 earnings of 0.55 per diluted share compared to 0.51 per diluted share in Q1 2014 Q2 includes a 5.2 million, (0.03) per diluted share after-tax, charges associated with the provision for uncertain collection…
Executive Summary Balance sheet Liquidity* of 1.1 billion at 06/30/2014 Cash and cash equivalents totaled 501 million at 06/30/2014 Net debt of 57 million at 06/30/2014 See updated debt maturity profile on slide 14 We define…
Operational Highlights Built for success, positioned for growth 8
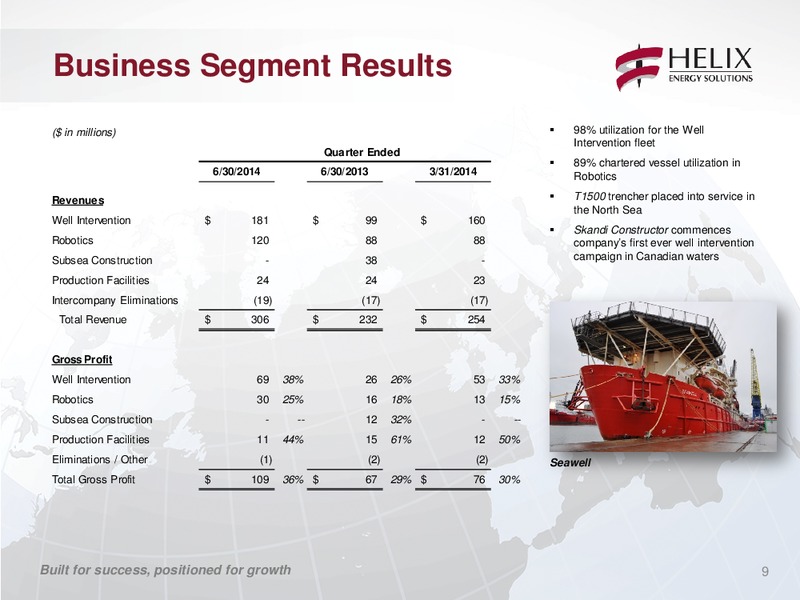
Business Segment Results ( in millions) 98% utilization for the Well Intervention fleet Quarter Ended 89% chartered vessel utilization in 6/30/2014 6/30/2013 3/31/2014 Robotics Revenues T1500 trencher placed into service in the…
Well Intervention GOM Q4000 was 90% utilized during Q2; off hire 9 days for planned annual inspection and thruster repairs Helix 534 fully utilized during Q2 Both vessels have full backlog for the remainder of 2014 IRS no. 2 on…
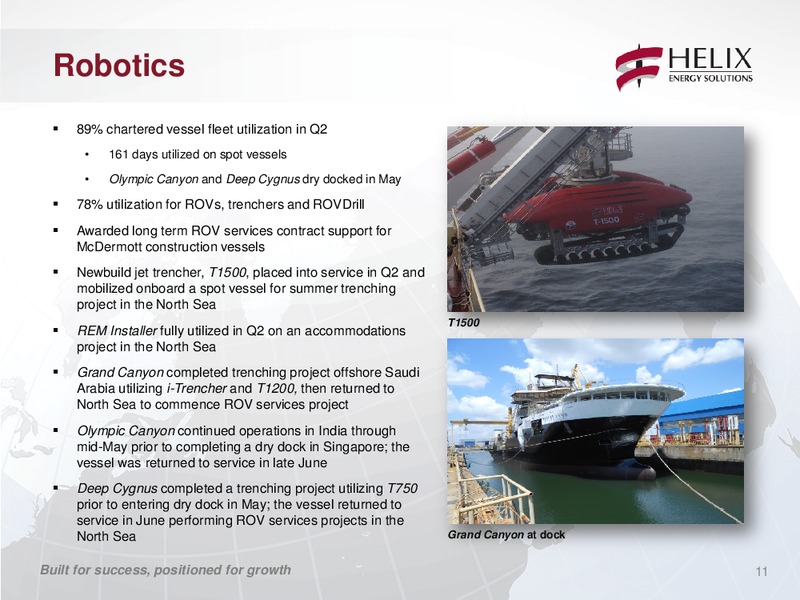
Robotics 89% chartered vessel fleet utilization in Q2 161 days utilized on spot vessels Olympic Canyon and Deep Cygnus dry docked in May 78% utilization for ROVs, trenchers and ROVDrill Awarded long term ROV services contract…
Utilization 100% 98% 98% 93% 91% 89% 80% 80% 78% 73% 61% 60% Q2 2014 Q1 2014 40% Q2 2013 20% 0% Well Intervention Vessels ROV and Trencher Support Vessels ROVs and Trenchers Seawell Olympic Canyon (1) 55 ROVs…
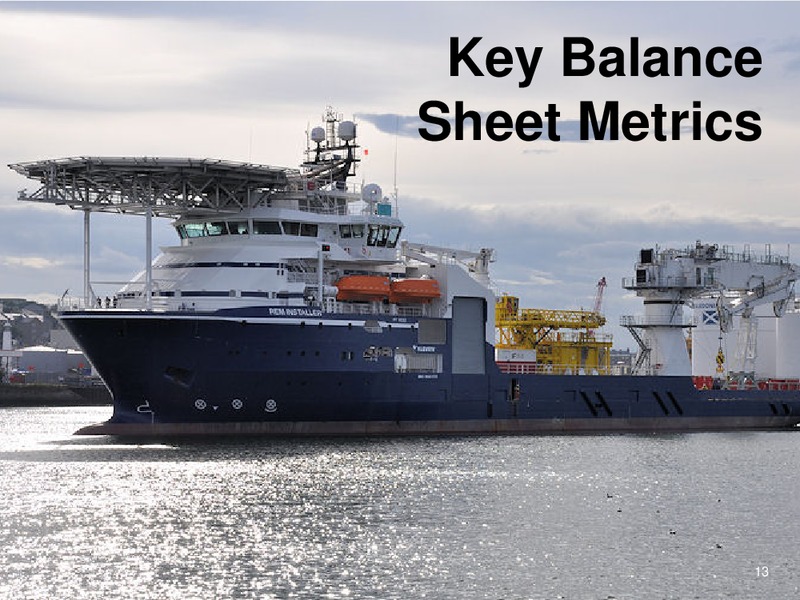
Key Balance Sheet Metrics Built for success, positioned for growth 13
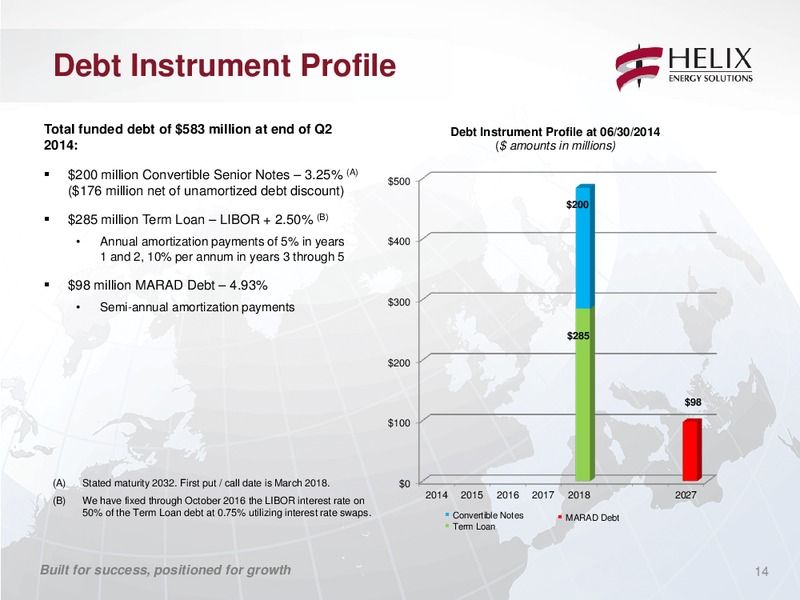
Debt Instrument Profile Total funded debt of 583 million at end of Q2 Debt Instrument Profile at 06/30/2014 2014: ( amounts in millions) 200 million Convertible Senior Notes 3.25% (A) 500 (176 million net of unamortized debt…
2014 Outlook Built for success, positioned for growth 16
2014 Outlook ( in millions, except per share data) 2014 2013 Outlook Actual Revenues (on-going operations) 1,060 805 EBITDA 360 300 CAPEX 375 343 Earnings Per Share (A) 1.65 1.75 1.04 Revenue Split: Well Intervention 635 452…
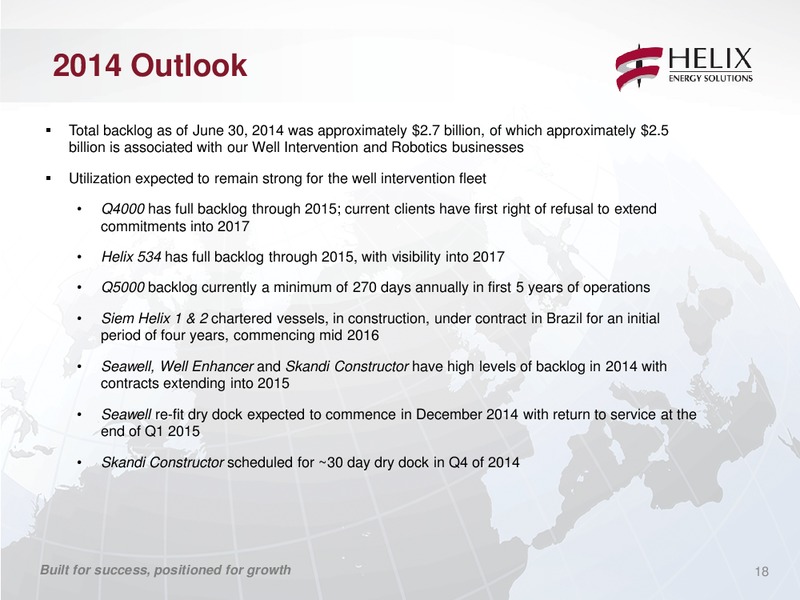
2014 Outlook Total backlog as of June 30, 2014 was approximately 2.7 billion, of which approximately 2.5 billion is associated with our Well Intervention and Robotics businesses Utilization expected to remain strong for the well…
2014 Outlook Trenching market in the North Sea, Norwegian Continental Shelf and Middle East more robust compared to 2013 T1500 performing well and has full backlog through Q3 2014 Rem Installer expected to transit to the Gulf of…
2014 Outlook Capex Total capital expenditures forecasted at approximately 375 million for 2014; 174 million incurred year-to-date(A) 105 million incurred in Q2, including: Approximately 69 million for well intervention newbuilds;…
Non-GAAP Reconciliations Built for success, positioned for growth 21
Non-GAAP Reconciliations ( in millions) Quarter Ended Six Months Ended 6/30/2014 6/30/2013 3/31/2014 6/30/2014 6/30/2013 Net income from continuing operations 58 28 54 112 29 Adjustments: Income tax provision 17 9 21 38 9 Net…
Follow Helix on Twitter: Helix_ESG Join the discussion on LinkedIn: www.linkedin.com/company/helix Built for success, positioned for growth
 Loading...