Presentation for the Johnson Rice Energy Conference September 29, 2015
Company Overview Technology focused, pure-play energy services company o Strong balance sheet position o Creating long-term shareholder value through strategic growth and returns on invested capital Two business segments o…
Oil States Today Consists of Offshore Products and Well Site Services Focused on delivering technology and solutions to the deepwater capital equipment and North American shale play markets Segment Contributions For Trailing Twelve…
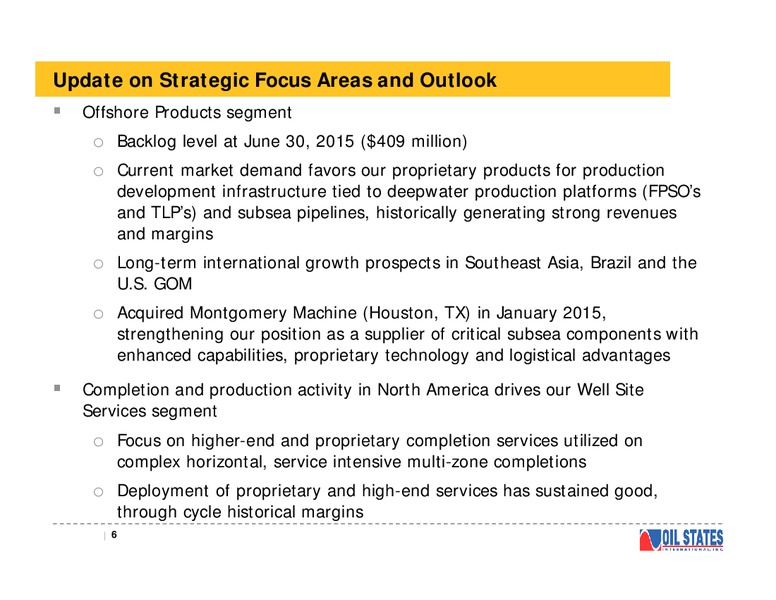
Update on Strategic Focus Areas and Outlook Offshore Products segment o Backlog level at June 30, 2015 (409 million) o Current market demand favors our proprietary products for production development infrastructure tied to deepwater…
Offshore Products Segment
Driven by Worldwide Deepwater Capital Spending Floating Production Facilities (FPSOs, TLPs and Spars) o Steel catenary riser connectors and receptacles o TLP tendon connectors o Riser tensioning equipment o Welding technology,…
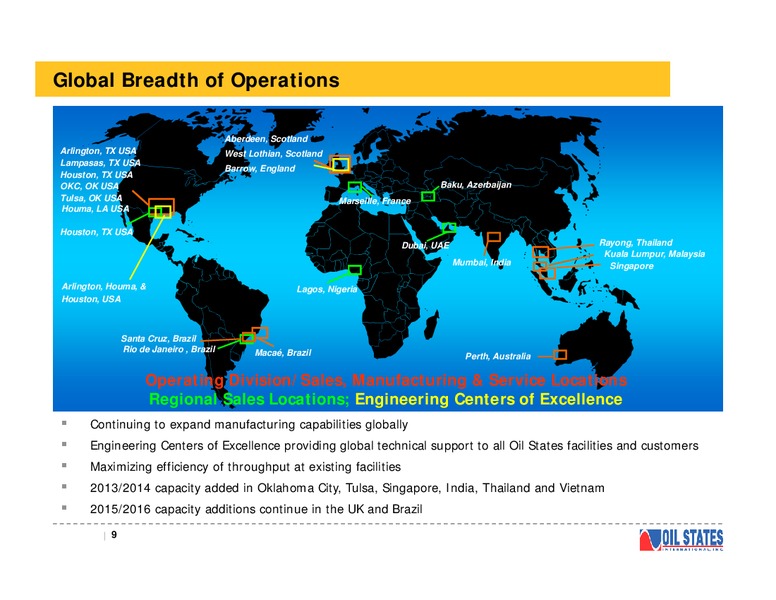
Global Breadth of Operations Aberdeen, Scotland Arlington, TX USA West Lothian, Scotland Lampasas, TX USA Barrow, England Houston, TX USA OKC, OK USA Baku, Azerbaijan Tulsa, OK USA Marseille, France Houma, LA USA Houston, TX USA…
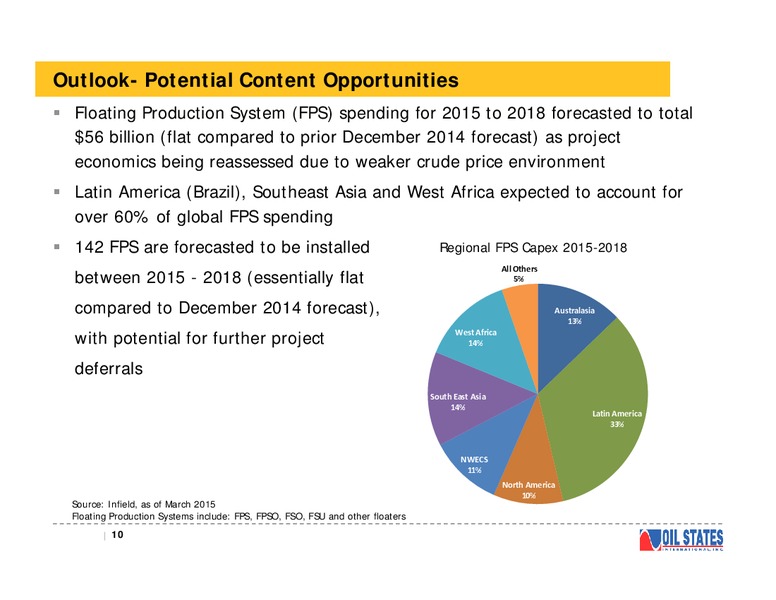
Outlook- Potential Content Opportunities Floating Production System (FPS) spending for 2015 to 2018 forecasted to total 56 billion (flat compared to prior December 2014 forecast) as project economics being reassessed due to weaker…
FPSO and Subsea Tieback Content Steel Catenary Riser (SCR) Free Standing Hybrid Riser (FSHR) Deck Equipment Subsea FlexJoints Upper Riser Assembly Cranes Spread Mooring Systems Receptacles Bend Stiffeners Mooring Winches…
Offshore Products Select Major Backlog Awards (June 13 June 15) Major backlog awards over the past 24 months that are over 10 million No large project awards were received in 2Q15 Customer Market Product Line Products Heerema Angola…
Offshore Products 2015 Outlook Current backlog and exposure to deepwater production infrastructure development projects has mitigated some of the commodity price volatility as these deepwater projects are generally longer-term in…
Well Site Services
Well Site Services Drilling Completion Services Wireline/ Frac/Pressure Well Drilling Coiled Tubing Pumping Flowback Testing Support Support Proprietary, technology driven, HPHT equipment which is well suited Own and operate 34…
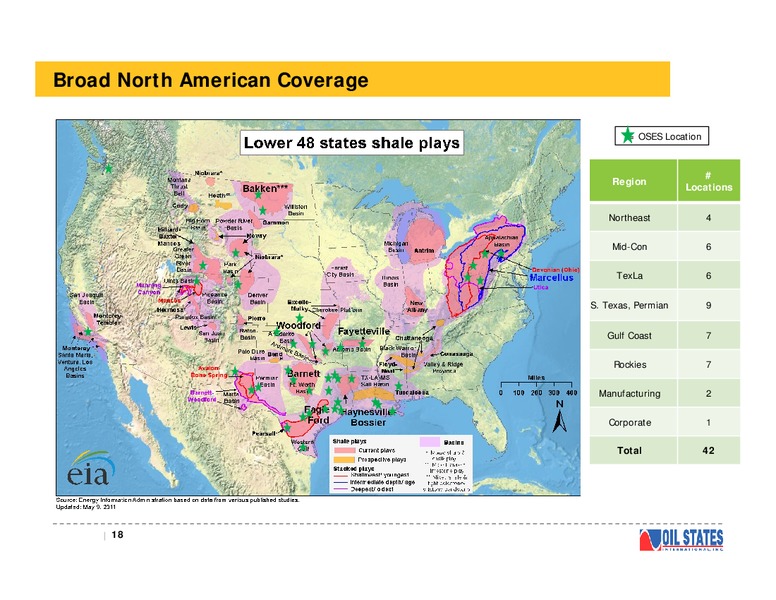
Broad North American Coverage = OSES Location Region Locations Northeast 4 Mid-Con 6 TexLa 6 S. Texas, Permian 9 Gulf Coast 7 Rockies 7 Manufacturing 2 Corporate 1 Total 42 18
Complex Completions Driving U.S. Spending and Activity Complex shale well completions, drilling rig efficiency and pad drilling characterize U.S. drilling and completion activity With our market presence in all major U.S. shale plays…
Completion Services Margin Performance With a broad market presence across all major U.S. shale plays, coupled with a focus on high-end proprietary technology, our completion services business is holding up decently compared to other…
U.S. Drilling and Completions Outlook The precipitous drop in oil prices has resulted in dramatically decreased drilling and completions activity in 2015 compared to 2014 Certain customers have elected to drill, but not complete wells…
Conclusions
Current Market Conditions North American rig count as of September 25, 2015 (per Baker Hughes) o 838 total U.S. rigs (57% below peak of 1,931 rigs in September 2014) 640 rigs drilling for oil compared to peak oil rig count of 1,609 in…
Key Drivers of Profitability Offshore Products o Backlog at June 30, 2015 totaled 409 million o Select deepwater developments moving forward, but project delays are ongoing o Continuing with our international manufacturing capacity…
Oil States Transformed into a technology-focused, pure-play oilfield services company o Offshore Products: deepwater capital equipment o Well Site Services: complex shale play development Quality customer base Strong balance sheet…
Appendix
Strong Financial Position (USD in millions, except percentages and ratios) 6/30/2015 Actual Working Capital 469.9 Current Debt 0.5 Revolving Credit Facility (Matures May 2019) 150.9 Other Debt 5.9 Total Debt 157.4 Shareholders'…
Non-GAAP Reconciliation (US dollars in millions) For The Year Ending December 31, For the Three Months Ending, LTM 2010 2011 2012 2013 2014 9/30/14 12/31/14 3/31/15 6/30/15 6/30/15 Well Site Services Net Income (Loss) 23 80 94 80…
Non-GAAP Reconciliation (US dollars in millions) For the Three Months Ending, LTM 9/30/14 12/31/14 3/31/15 6/30/15 6/30/15 Oil States International, Inc. Net Income (Loss) 58 58 19 6 142 Income Tax Provision (Benefit) 32 33 13 1…
 Loading...