Pillars of PKN ORLEN Strategy for 2014-2017 Financial strength Dividend: DPS increase* Value creation EBITDA: PLN 5.1 billion** People Values: ORLEN * DPS, Dividend per Share **The average annual EBITDA LIFO in 2014-2017…
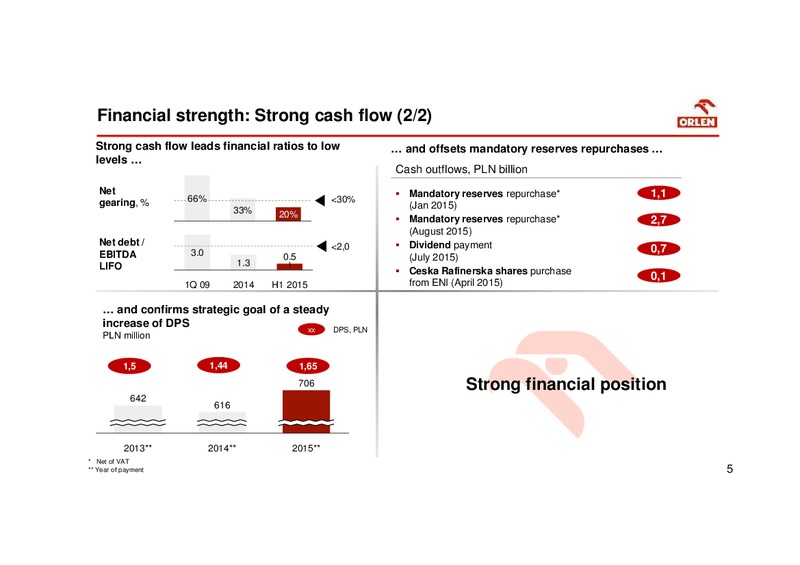
Financial strength: Flexibility and resilience to market volatility (1/2) Foundations Objectives Guaranteed sources of funding (over EUR 4 billion) Financial ratios Rating - investment grade Optimal maturity Financial gearing -…
Value creation: Significant EBITDA LIFO improvement (1/2) What we have planned for 2014 2017 and what we delivered so far EBITDA LIFO* plan for 2014 - 2017, PLN billion EBITDA LIFO* execution H1 2013 H1 2015, PLN billion 5.1 +0.4 4.8…
Value creation: CAPEX focused on growth (2/2) We reconfirm CAPEX set in the strategy as well as our growth directions CAPEX structure by type of investment Development Downstream 2014-2017, PLN billion Value chain enhancement…
PEOPLE: Key pillar of our strategy (1/4) 90 PKN ORLEN stock performance PLN PEOPLE VALUE CREATION ORLEN 1.0 ORLEN FINANCIAL ORLEN STRENGTH 2.0 3.0 2000 2005 2010 2015 8
PEOPLE: Even more important in unpredictable times (2/4) They hired outstanding people whenever and wherever they found them, often without any specific job in mind. That's how you build the future () If I'm not smart enough to…
PEOPLE: ORLEN values as a foundation of our culture (3/4) ODPOWIEDZIALNO RESP ONSIBILITY Szanujemy naszych klientw, We respect our customers, akcjonariuszy, rodowisko naturalne shareholders, natural environment oraz lokalne…
PEOPLE: Focus on leadership (4/4) Management is doing things right; Leadership is doing the right things Peter F. Drucker Quotation source: Peter F. Drucker, The Essential Drucker, P. F. Drucker - www.centroatl.pt;…
Key messages Determined to deliver our strategy Well prepared for unpredictable future Seizing the opportunity Focusing on people 12
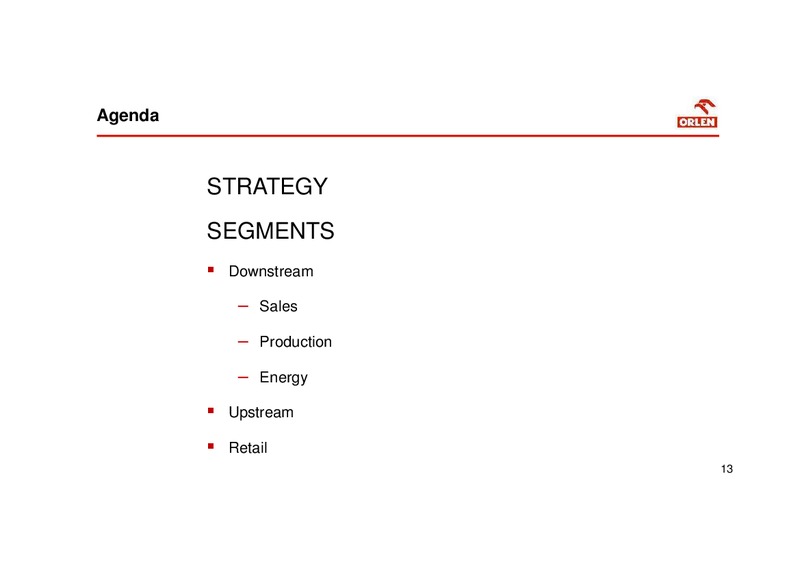
Agenda STRATEGY SEGMENTS Downstream Sales Production Energy Upstream Retail 13
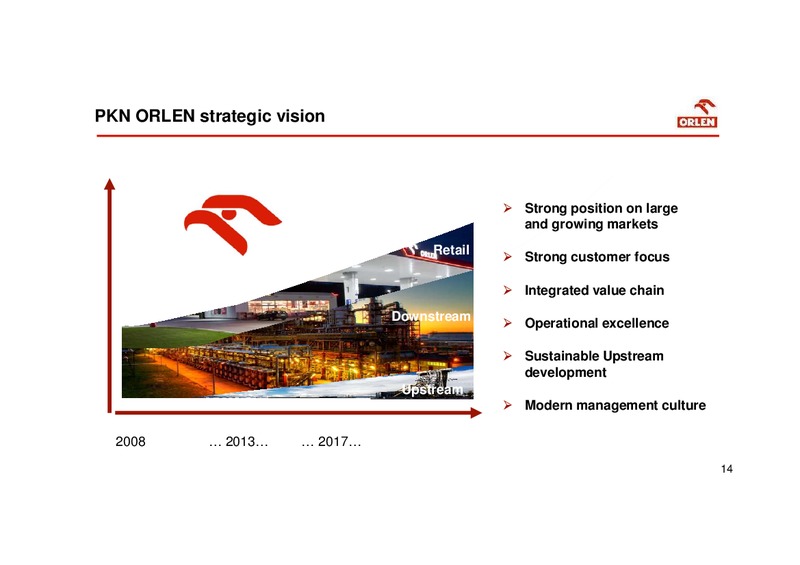
PKN ORLEN strategic vision Strong position on large and growing markets Retail Strong customer focus Integrated value chain Downstream Downstream Operational excellence Sustainable Upstream development Upstream Modern…
Downstream - Sales Marek Podstawa Management Board member 15
Strong position on large and growing markets (1/2) Sales gravity centers located in countries developing ...which offer further growth potential both in fuels... faster than the rest of the EU Fuel consumption in Central Europe 3,9%…
Strong position on large and growing markets (2/2) Key player on home fuel markets... significant market share in all petrochemical product groups Actual fuel market share* ORLEN Groups share in Central Europe production capacity, %…
Well balanced channels of trade on attractive markets We are selling throught well-balanced channels of trade... ... to attractive markets ... Volume share in respective channels* Retail Others Inland wholesale 22% Ukraine Poland…
Modern management culture Experienced, well trained and highly motivated team PEOPLE Top Employer according to sales managers of the largest Polish companies Emphasis on customer relationship CUSTOMERS Supply quality and…
Key strategic directions: Capture value on growing Central European markets Fuel marketing Development of trading competences Expansion to attractive, neighbouring markets Capture higher demand from diminishing grey zone…
Downstream - Production Krystian Pater Management Board member 21
Downstream benefits from favourable market environment Good macro conditions with an increase in capacity utilization and sales intensification Model margin - Downstream USD/bbl Capacity utilisation +4,7 USD/bbl % Refineries 2Q14…
Constant efficiency increase mitigates the external risks Risks Business implications Competitive advantages of Downstream Refinery utilization rate in European Union*, % Integration of refinery, petrochemical and energy Weak…
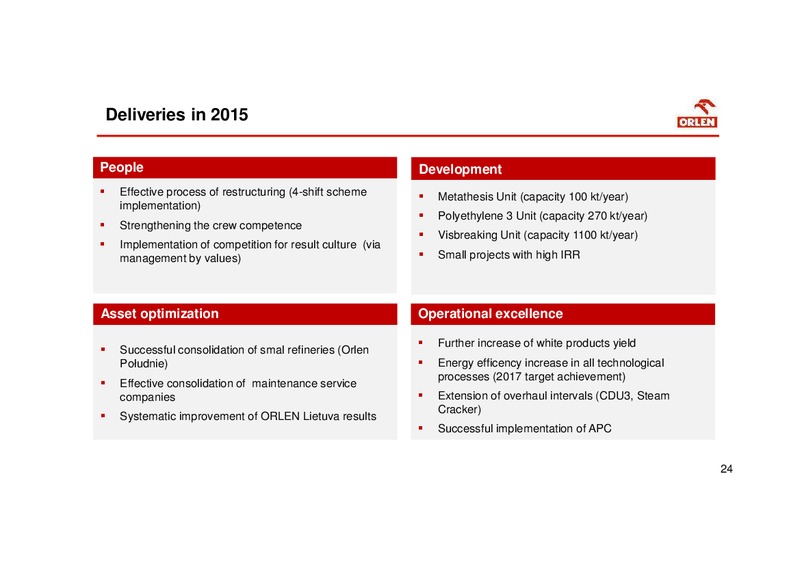
Deliveries in 2015 People Development Effective process of restructuring (4-shift scheme Metathesis Unit (capacity 100 kt/year) implementation) Polyethylene 3 Unit (capacity 270 kt/year) Strengthening the crew competence Visbreaking…
Value creation drivers Energy intensity optimization despite the end of production cycle of main assets Reduction of heat losses Reduction of hydrocarbon losses and own consumption Reduction of energy consumption in technological…
Overdelivery of strategic targets Refinery 2013 H1 2015 2017 EBITDA LIFO by segments 2013 2017, PLN billion Processed crude oil (mln tonnes) 27,8 14,8 29,9 93,9 Fuel yield, (%) Energy 77,0 77,8 76,9 Energy consumption 92,4 90,9 86,9…
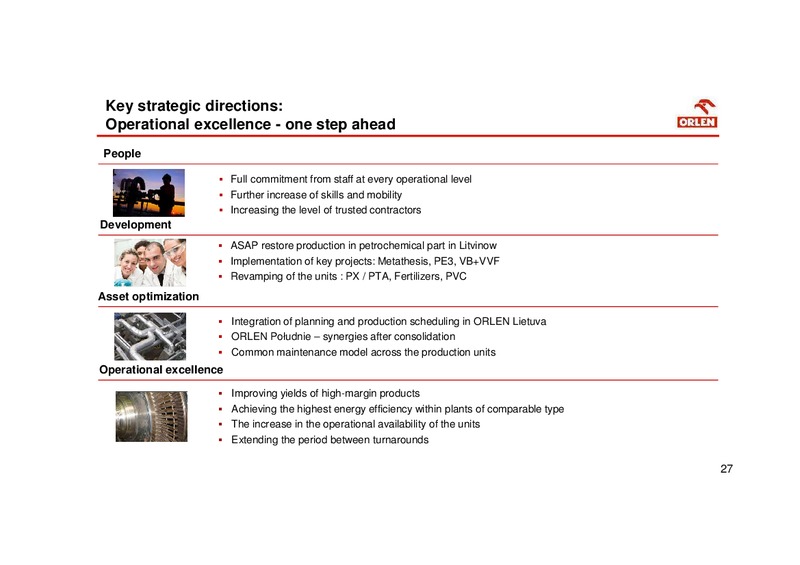
Key strategic directions: Operational excellence - one step ahead People Full commitment from staff at every operational level Further increase of skills and mobility Increasing the level of trusted contractors Development ASAP…
Agenda Downstream - Energy Piotr Chemiski Management Board member 28
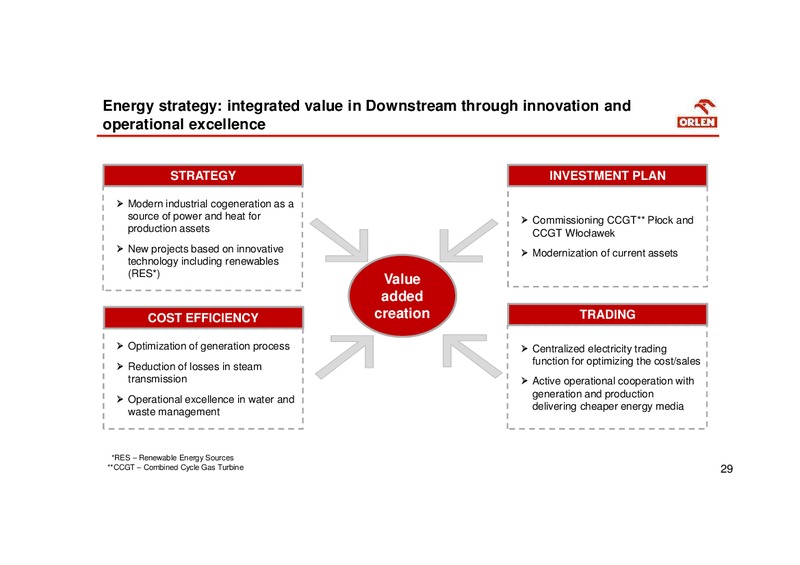
Energy strategy: integrated value in Downstream through innovation and operational excellence STRATEGY INVESTMENT PLAN Modern industrial cogeneration as a source of power and heat for Commissioning CCGT** Pock and production assets…
Extensive experience in industrial cogeneration Key operational data, H1 2015 Total installed gross electric capacity (MWe) 759,5 Total installed gross thermal capacity (MWt) 4 618 Electricity production (GWh) 1 266…
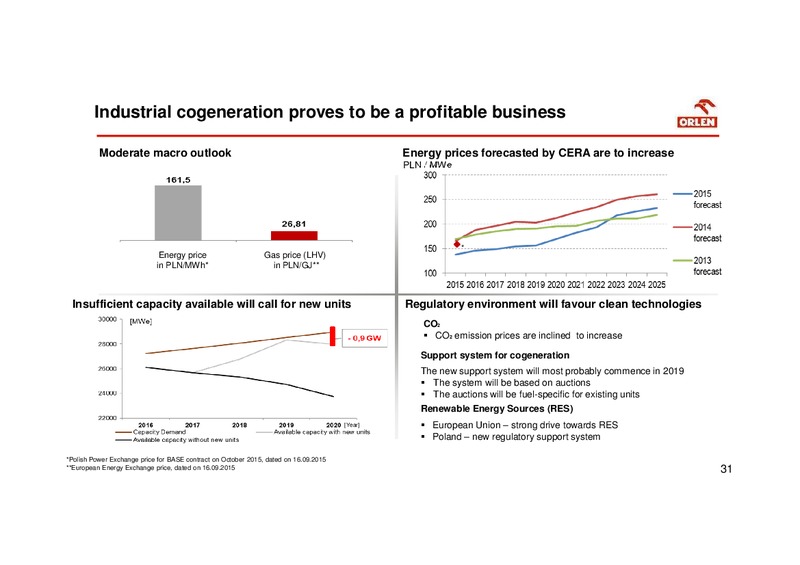
Industrial cogeneration proves to be a profitable business Moderate macro outlook Energy prices forecasted by CERA are to increase PLN / MWe * Energy price Gas price (LHV) in PLN/MWh* in PLN/GJ** Insufficient capacity…
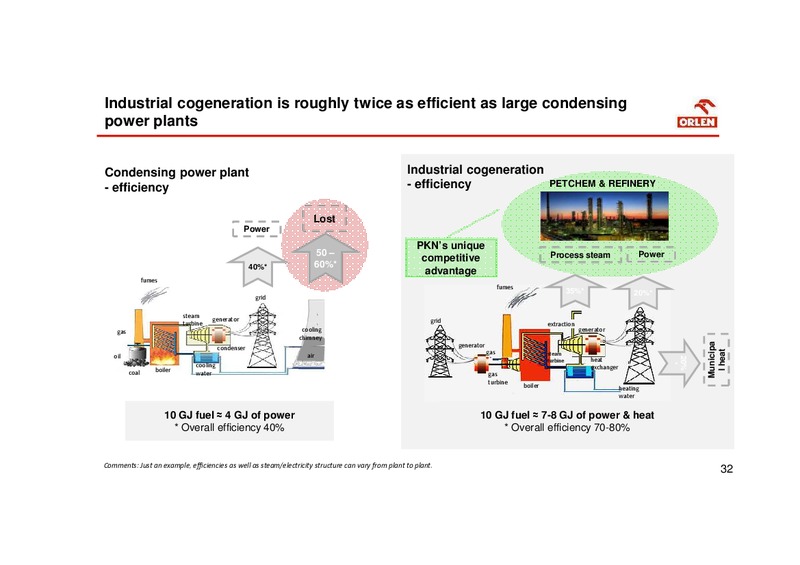
Industrial cogeneration is roughly twice as efficient as large condensing power plants Condensing power plant Industrial cogeneration - efficiency - efficiency PETCHEM & REFINERY Lost Power PKNs unique 50 Process steam Power…
CCGT Wocawek and Plock: Attractive technology at a competitive price Total budget CAPEX / MWe Revenue structure index* EUR million /MWe index / annum median 0.83 CCGT Wocawek 0,74 CCGT Pock 0,6 * Revenue (in index terms)…
Becoming a leader in operational excellence and natural gas cogeneration sector in Poland Flue-gas desulfurization (FGD) CCGT Wocawek CCGT Pock 2015 2016 2017/2018 Compliance with the EU Capacity: 463 MWe (net) Capacity: 596 MWe…
Key strategic directions: Focus on industrial cogeneration and operational excellence Industrial cogeneration Focus on industrial cogeneration projects utilising synergies with Petchem & Refining segment CCGT Wocawek CCGT Pock Cost…
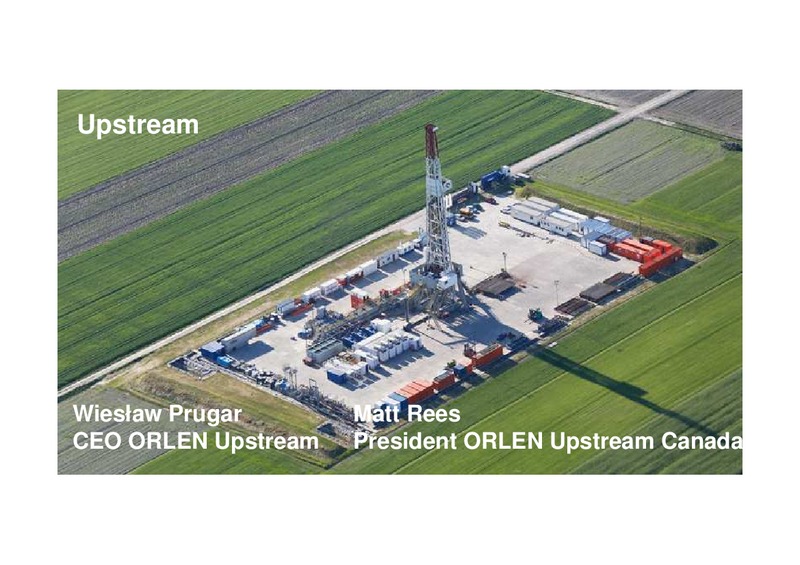
Agenda Upstream Wiesaw Prugar Matt Rees CEO ORLEN Upstream President ORLEN Upstream Canada 36
Global macro environment: While pricing has decreased recently, most forecasts indicate recovery WTI Oil Price History/Forecasts Henry Hub Gas Price History/Forecasts USD/bbl USD/MMBtu 37 * WTI and Henry Hub price forecasts…
ORLEN Upstream: we aim at continuing growth our presence in Poland and Canada Poland and Canada are stable markets where geopolitical risk is low Why Canada Stable financial system Favorable tax regime One of the largest oil…
ORLEN Upstream Canada: growth on quality assets Key Features Strong position in proven areas Application of horizontal multi- stage frac technology RLI*: 17 years Key Advantages Highly experienced team Assets with high upside…
ORLEN Upstream Canada: well positioned for acquisitions Focused land base Running room Key Upside potential screening Leverage existing skillset criteria Right transaction size Gas to liquids ratio Operatorship Focus on the key…
ORLEN Upstream Poland: further diversification of assets portfolio Key Features Continued exploration works in unconventional projects: Lublin Shale (shale gas, focus on areas with higher exploration potential), Mid-Poland…
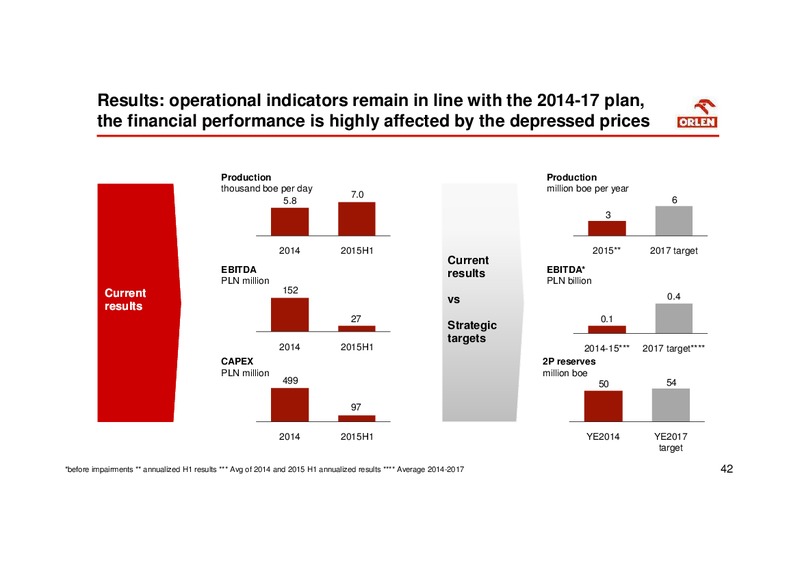
Results: operational indicators remain in line with the 2014-17 plan, the financial performance is highly affected by the depressed prices Production Production thousand boe per day million boe per year 7.0 5.8 6 3 2014 2015H1…
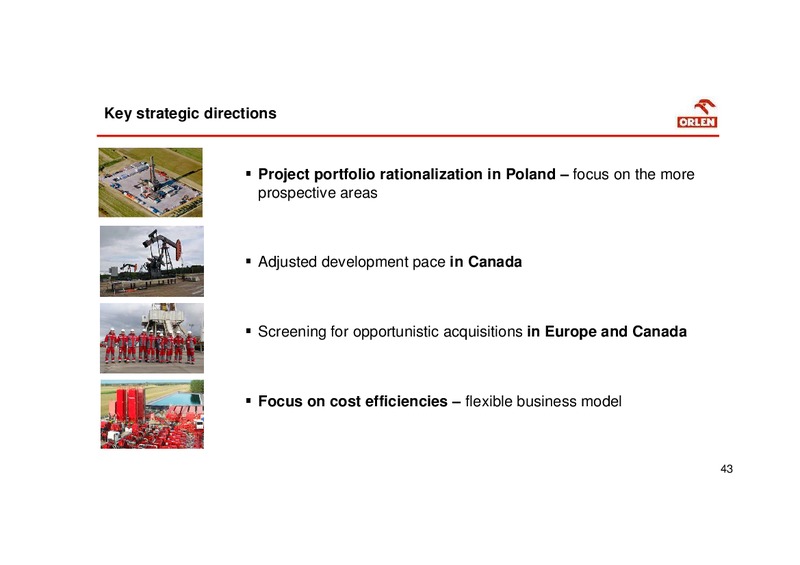
Key strategic directions Project portfolio rationalization in Poland focus on the more prospective areas Adjusted development pace in Canada Screening for opportunistic acquisitions in Europe and Canada Focus on cost…
The Upstream Team 44 44
Retail Marek Podstawa Management Board member 45
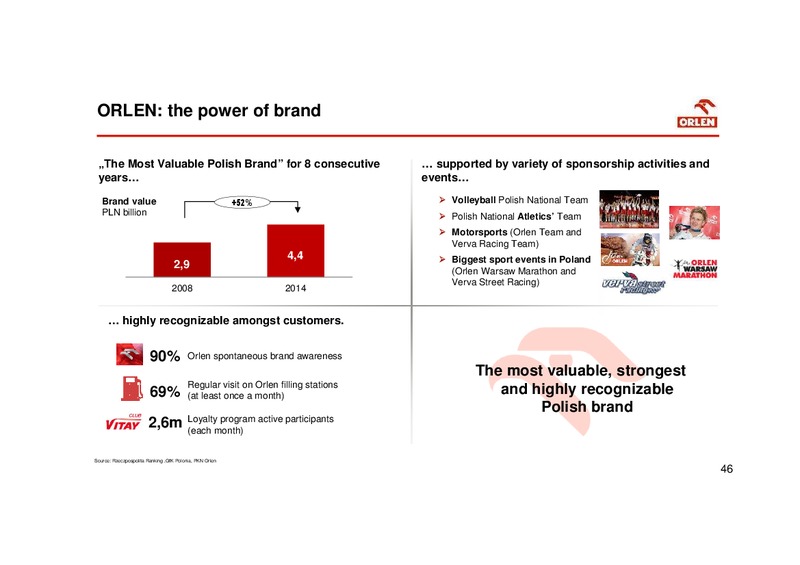
ORLEN: the power of brand The Most Valuable Polish Brand for 8 consecutive supported by variety of sponsorship activities and years events Brand value +52% Volleyball Polish National Team PLN billion Polish National Atletics Team…
Strong competitive market position Operational performance in line with strategic with high quality of service commitments H1 2014 H1 2015 2017* Customer Service Excellence Star 2014 and 2015 Share in home Petrol Station of the year…
Further retail development focused on value creation Selective network development with significant increase of Stop Cafes Number of Stop Cafes in Poland Number of stations +15% +3% 2.692 2.682 2014 H 1 2015 2017 thanks to…
Key strategic directions: From a solid product supplier to customer experience provider Fuel store Core competence Must have for a filling station High quality of fuels and services Convenience and fast shopping Increasing market…
 Loading...