Clear vision and growth strategy Vision Strategy To be a leading North To realize opportunities created American energy infrastructure by the renaissance of natural company gas and by the increasing demand for clean energy Energy…
Diversified energy infrastructure EBITDA2 by segment 2 Bcf/d Gas of natural gas Processing and moving transacted natural gas to key markets including Asia 1,530 MW Power of power generation Generating clean energy in five…
Highly contracted earnings provide stability Long life, diversified and Expect 10 to 15 percent year-over-year EBITDA growth profitable infrastructure 2% unhedged Frac and AB Power 2014 2015 Stable Hedged Unhedged 30%…
Base growth capital fully funded: 2015 2019 Current bank liquidity, cash & short-term investments DRIP 3.5B Capital projects Cash flow Dividends1 Uses Sources Ample liquidity to fund 2015 2019 capital growth…
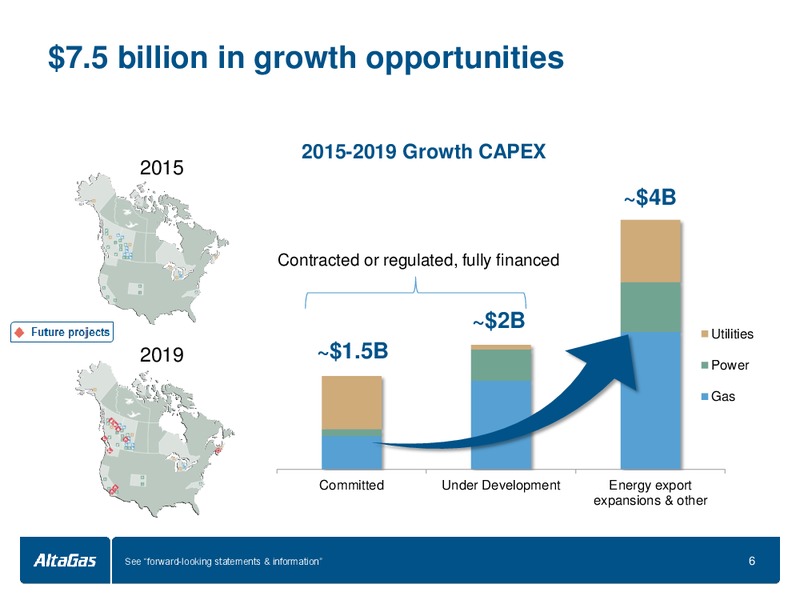
7.5 billion in growth opportunities 2015-2019 Growth CAPEX 2015 4B Contracted or regulated, fully financed 2B Utilities 2019 1.5B Power Gas Committed Under Development Energy export expansions & other See…
Building infrastructure to serve new markets From wellhead to markets Existing assets Growth projects North Rail, truck American Fort Sask. & Markets hub2 NGL Storage, rail & truck offloading2 pipelines2 Ferndale Terminal1…
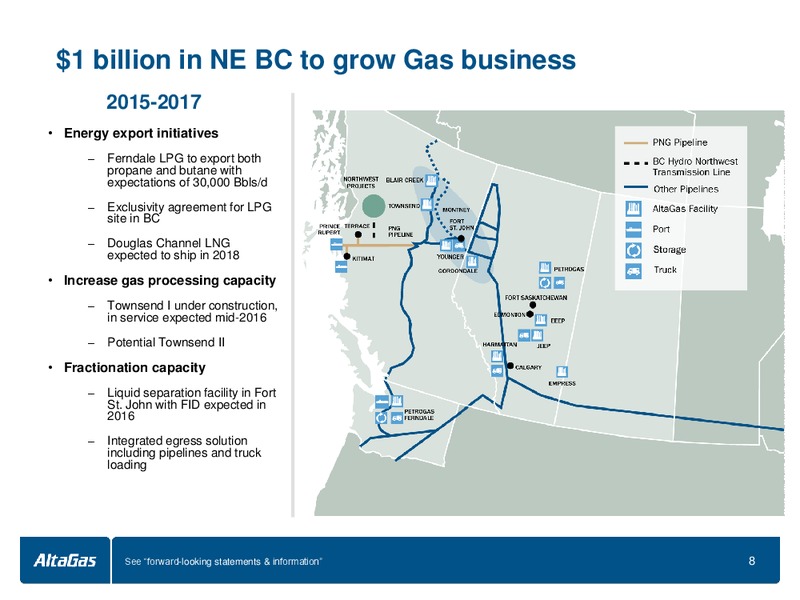
1 billion in NE BC to grow Gas business 2015-2017 Energy export initiatives Ferndale LPG to export both propane and butane with expectations of 30,000 Bbls/d Exclusivity agreement for LPG site in BC Douglas Channel LNG…
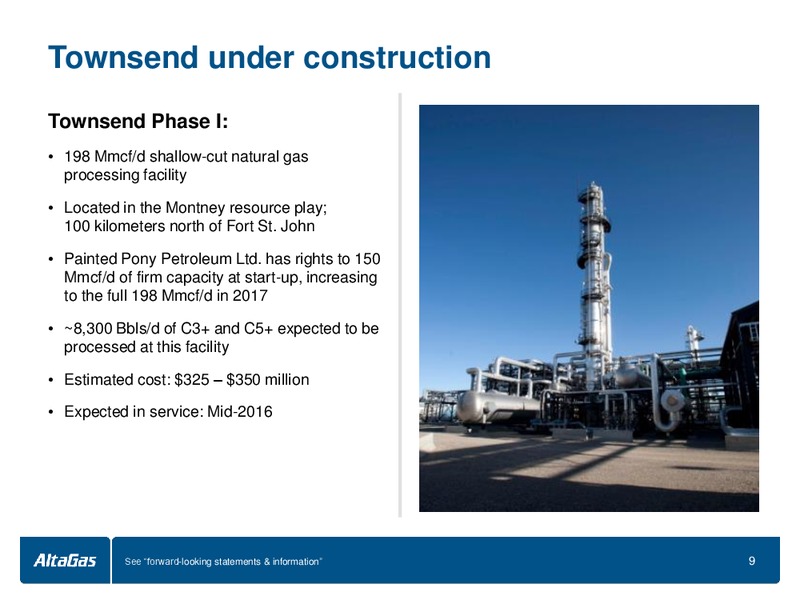
Townsend under construction Townsend Phase I: 198 Mmcf/d shallow-cut natural gas processing facility Located in the Montney resource play; 100 kilometers north of Fort St. John Painted Pony Petroleum Ltd. has rights to 150 Mmcf/d…
Growing our LPG export business Canada Exclusivity agreement for a site in British Columbia 25,000 Bbls/d with significant expansion opportunities Final investment decision in 2016 U.S. Ferndale Exporting LPG to Asia Achieved…
FSJ liquids separation and rail loading terminal See forward-looking statements & information Fort St. John: Development has begun for a liquids separation facility to serve producers in the Montney Very well connected by rail to…
FSJ can provide new liquids hub for producers FSJ expands our existing liquids separation and rail loading capabilities Potential to increase liquids separation capability by 55 percent See forward-looking statements &…
DC LNG 0.55 million tonnes per year capacity Long-term lease agreements executed with Haisla Nation for land and water tenure Lease agreement executed with PNG for long-term pipeline capacity to supply gas Consortium to…
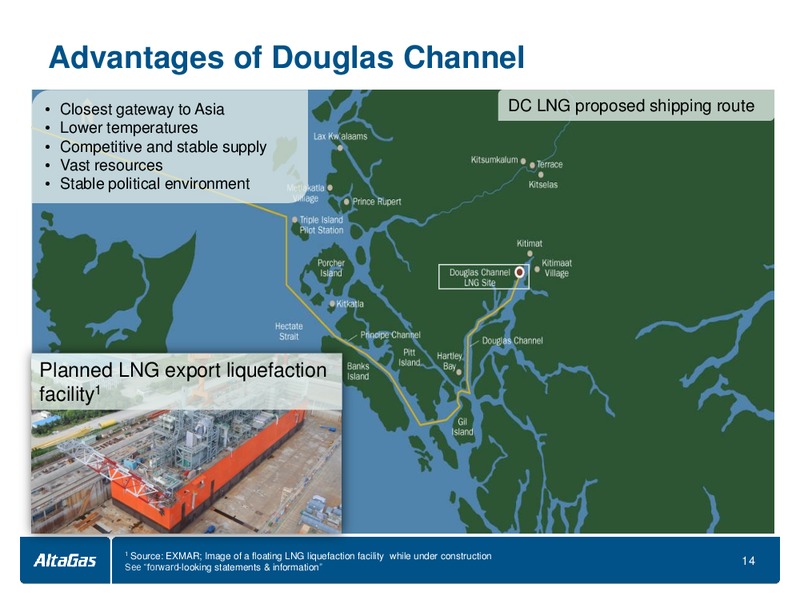
Advantages of Douglas Channel Closest gateway to Asia DC LNG proposed shipping route Lower temperatures Competitive and stable supply Vast resources Stable political environment Planned LNG export liquefaction facility1…
Growing 1.5 billionour Power to grow portfolio Power business 75% of generation from clean energy sources1 1.5 billion 2015 2019 1,449 MW in operation Additional 81 MW under construction power 2,360 MW in various stages of…
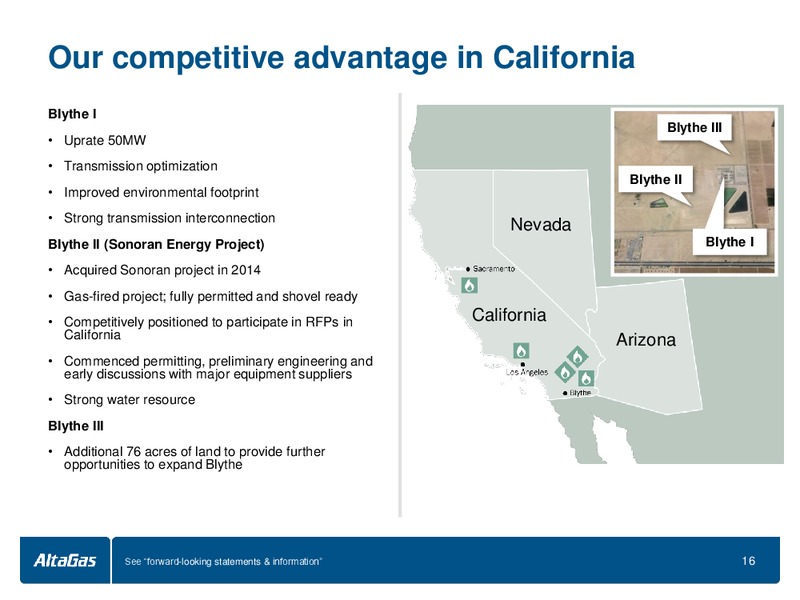
Our competitive advantage in California Blythe I Blythe III Uprate 50MW Transmission optimization Blythe II Improved environmental footprint Strong transmission interconnection Nevada Blythe II (Sonoran Energy Project) Blythe I…
Growing and improving our Utilities 1 billion capital spend program 2015 2019 Million 700 600 million increase in rate base over next five years 600 500 Capital spend Depreciation 7% 400 CAGR 300 200 100 0 2015F 1…
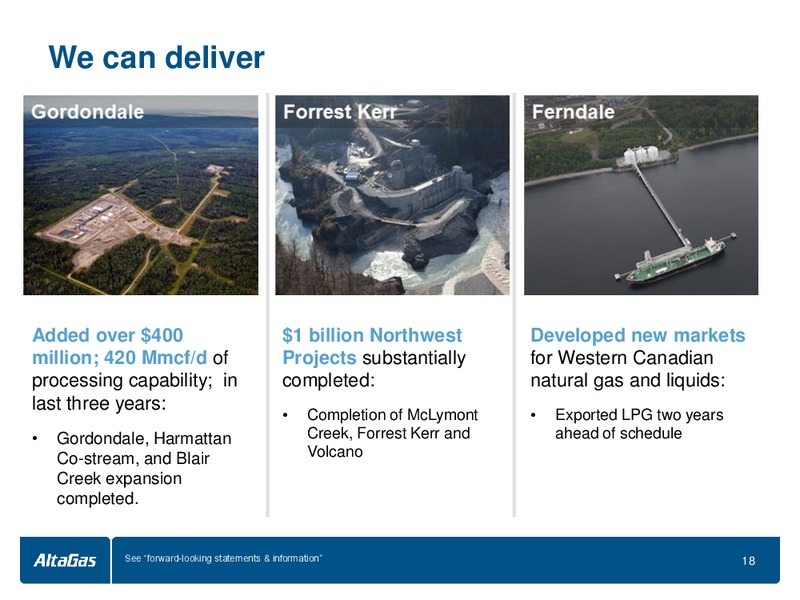
We can deliver Added over 420 Gordondale 1 billion Forrest Northwest Kerr Developed Ferndale new Mmcf/d of processing projects substantially markets for Western capability in last three completed: Canadian natural gas: years:…
Appendix See forward-looking statements & information 19
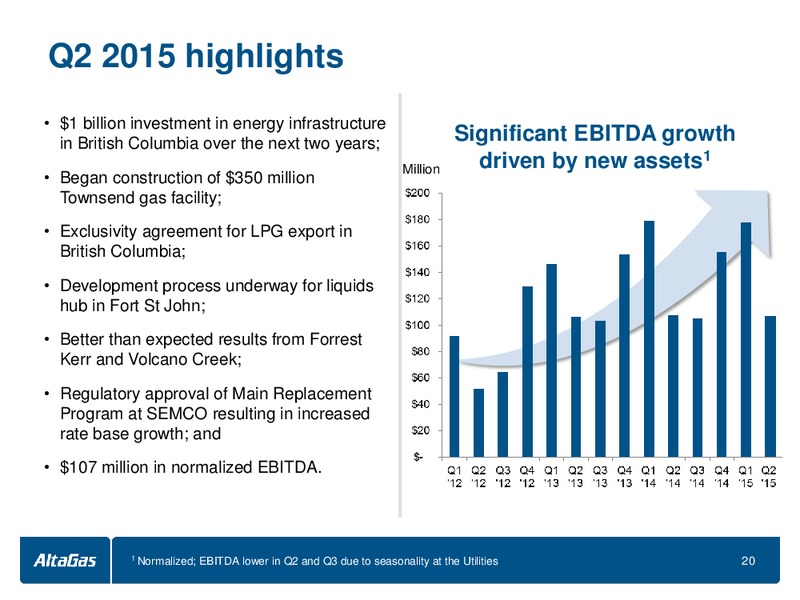
Q2 2015 highlights 1 billion investment in energy infrastructure in British Columbia over the next two years; Significant EBITDA growth Million driven by new assets1 Began construction of 350 million Townsend gas facility;…
Strong track record of growth Normalized EBITDA Normalized Funds From Operations Million Million 600 500 500 400 400 300 300 200 200 100 100 0 0 2006 2004 2005 2007 2008 2009 2010 2011 2012 2013 2014 2009…
Capital allocation program drives growth Disciplined in managing balance sheet and allocating capital Excess Normalized FFO available Million for capex and dividend growth 26% 22
Balanced debt and capital structure Manageable capital structure1 Average debt maturity of 8.1 years2 Million 1As of June 30, 2015 2 Asof July 31, 2015 23 See forward-looking statements & information
 Loading...