3rd Quarter 2015 Financial Results Next step in our Transformation Plan Focus on high added value businesses Five operated vessels mainly dedicated to Multi-Client Q3 2014, Q2 2015 and Q3 2015 are presented before Non-Recurring…
Our long-standing Strategic Rationale Transform CGG, from a Seismic Acquisition Company into an Integrated Geoscience Company We have been pursuing this journey for the last two years Today, we are intensifying our plan due to…
Transformation Plan: what we have delivered so far Marine monthly cost structure G&A expenses Base (m) 100 161 (51)% (55)% 80 114 49 73 YE 2013 Q3 14 Q3 15 Full cost base including Depreciation & Amortization 3Q 13 3Q 14 3Q…
Transformation Plan: The next step Focus on high-end added value businesses Portfolio Operated fleet 2/3 dedicated to Multi-Client programs Rebalancing GGR representing more than 60% of revenue and Contractual Data Acquisition less…
Q3 2015: Business Overview 6
Q3 2015: A good cash performance Group Revenue (In million ) Group Revenue at 470m, stable sequentially 694 Operating Income at 4m Reduced losses for Contractual marine data acquisition 473 470 EBIT at 15m, including a 11m…
Equipment: Impacted by lower volumes Revenue (In million ) Marine Equipment Sales at 103m, quite stable sequentially Land Equipment 180 Low volumes impacted by weak marine sales 40 71% Land and 29% Marine 107 103 Internal…
Contractual Data Acquisition1: Deteriorated market conditions Contractual Data Total revenue at 152m, up 17% sequentially Acquisition Revenue (In million ) Land & MP Contractual Marine revenue at 110m, up 29% Marine sequentially…
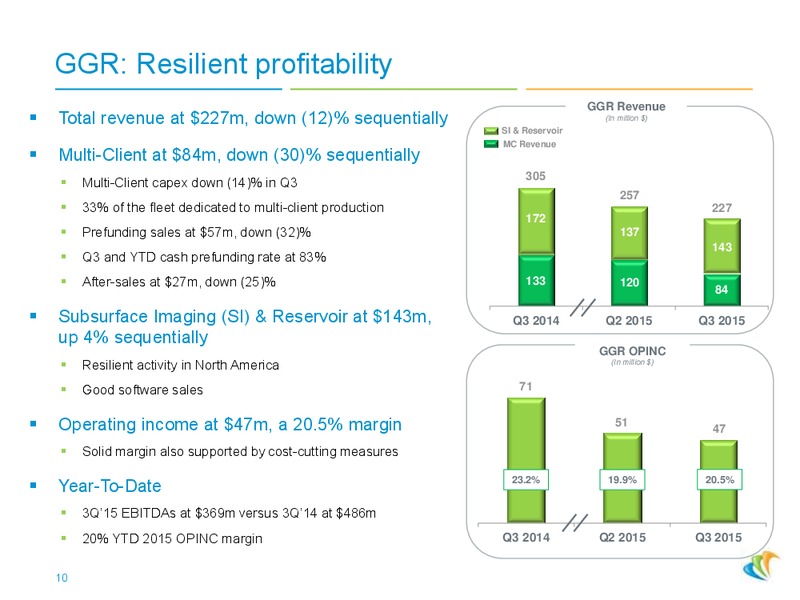
GGR: Resilient profitability GGR Revenue Total revenue at 227m, down (12)% sequentially (In million ) SI & Reservoir MC Revenue Multi-Client at 84m, down (30)% sequentially 305 Multi-Client capex down (14)% in Q3 257 33% of the…
Non-Operated Resources (N.O.R) Creation of this new reporting segment to improve Non-Operated Resources OPINC quality of reporting (In million ) 60 Scope Q3 2014 Q2 2015 Q3 2015 Cold-stacked vessels: maintenance costs and Hull…
Financial review 12
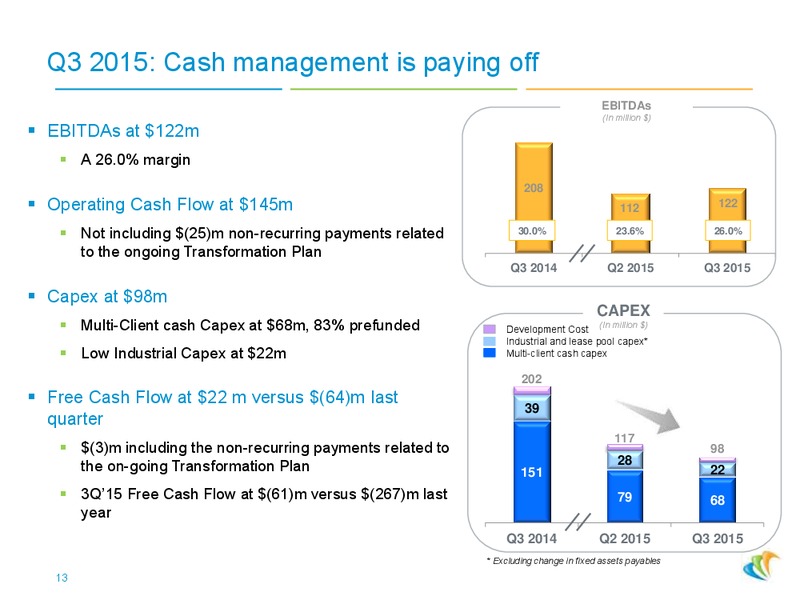
Q3 2015: Cash management is paying off EBITDAs (In million ) EBITDAs at 122m A 26.0% margin 208 Operating Cash Flow at 145m 112 122 Not including (25)m non-recurring payments related 30.0% 23.6% 26.0% to the ongoing…
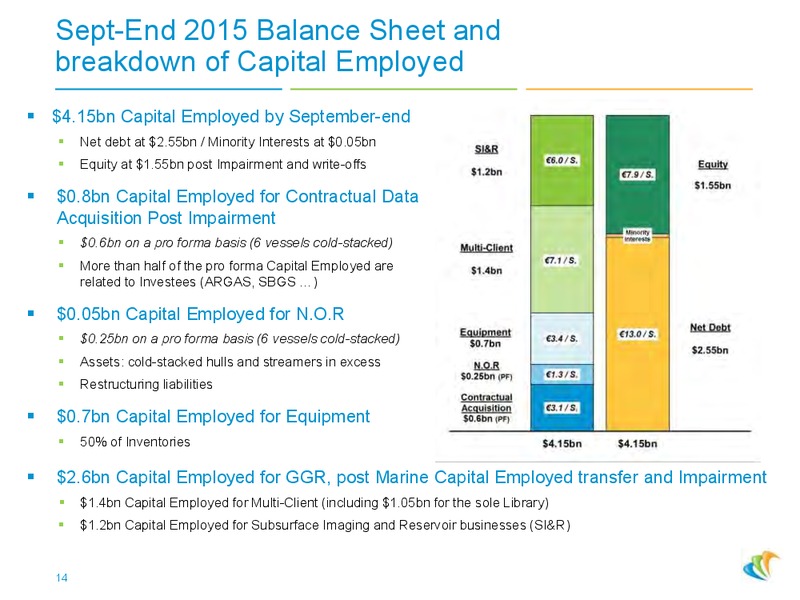
Sept-End 2015 Balance Sheet and breakdown of Capital Employed 4.15bn Capital Employed by September-end Net debt at 2.55bn / Minority Interests at 0.05bn Equity at 1.55bn post Impairment and write-offs 0.8bn Capital Employed for…
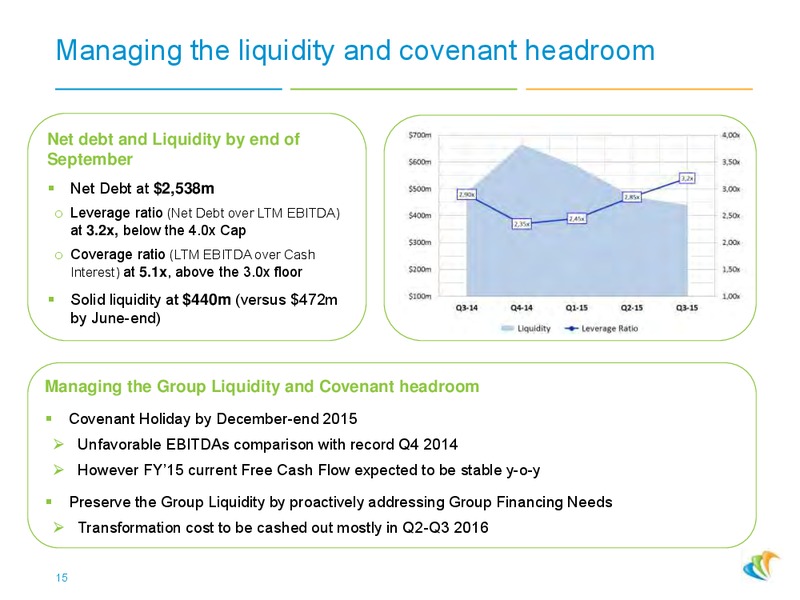
Managing the liquidity and covenant headroom Net debt and Liquidity by end of September Net Debt at 2,538m o Leverage ratio (Net Debt over LTM EBITDA) at 3.2x, below the 4.0x Cap o Coverage ratio (LTM EBITDA over Cash Interest) at…
Conclusion 16
A rebalanced company A reduced exposure to Marine acquisition: Fleet of 5 active vessels 2/3 of our fleet capacity to be dedicated to Multi-Client programs GGR: A unique integrated geoscience platform with two key businesses…
Appendix 18
New segment reporting Equipment: seismic equipment used for data acquisition, both onshore and offshore No change to the existing segment Contractual Data Acquisition: Marine offshore seismic data acquisition and Land and…
Data Acquisition: Deteriorated market conditions (former breakdown) Data Acquisition Revenue Total revenue at 225m, up 1% q-o-q Land & MP (In million ) External revenue at 148m, up 25% Marine 418 Marine revenue at 183m, up 2%…
GGR: Continuing sustained profitability (former breakdown) GGR Revenue Total revenue at 227m, down (12)% q-o-q (In million ) SI & Reservoir MC Revenue Multi-Client at 84m, down (30)% q-o-q 305 Multi-Client capex down (14)% in Q3…
 Loading...