CEO Remarks Limit capital expenditures to Funds Flow from Operations Balance Sheet and Recent 35% workforce reduction Cost Structure Suspension of the dividend Reduction in Board compensation Viking drilling & completions costs…
CFO Remarks Disposition of Mitsue properties closed on October 30 for 400MM in Dispositions 193MM Announced Since Announced disposition of Weyburn Unit working interest September 1st for proceeds of 205MM, which is expected to…
Net Debt Bridge Q2 2015 vs. Q3 2015 Net Debt (MM) 5 19 2,414 398 116 9 1 104 45 165 2,205 2,016 507 484 Decrease in Net Debt Increase in Net Debt Net Working Capital Deficit Bank Debt Senior Debt 1,722 1,742 Q2/15…
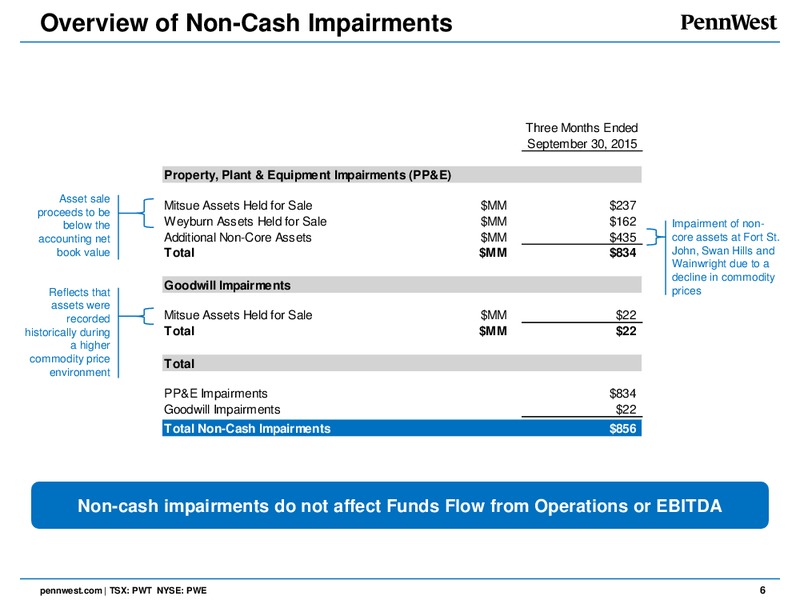
Overview of Non-Cash Impairments Three Months Ended September 30, 2015 Property, Plant & Equipment Impairments (PP&E) Asset sale proceeds to be Mitsue Assets Held for Sale MM 237 below the Weyburn Assets Held for Sale MM 162…
Current Hedge Position Hedging program continues to help reduce the volatility of our funds flow from operations, thereby improving our ability to align capital programs going forward In Q3 2015, we began to extend crude oil hedge…
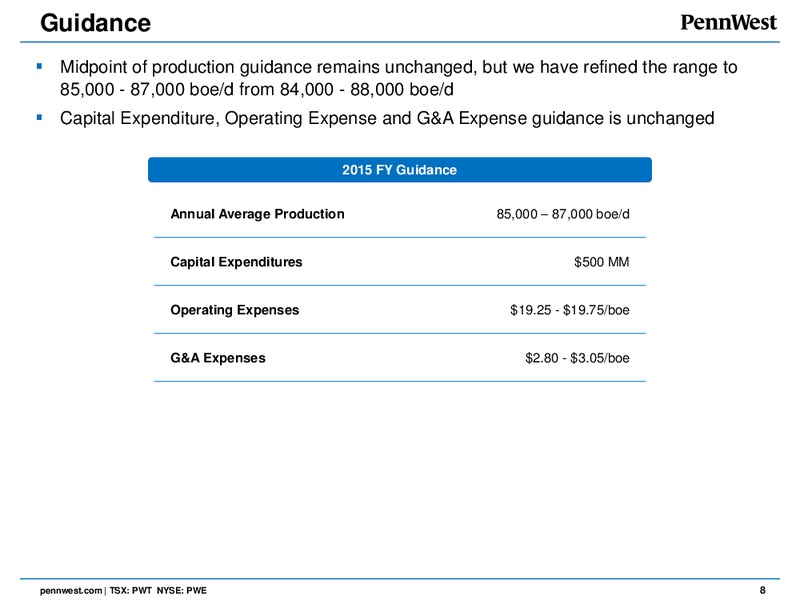
Guidance Midpoint of production guidance remains unchanged, but we have refined the range to 85,000 - 87,000 boe/d from 84,000 - 88,000 boe/d Capital Expenditure, Operating Expense and G&A Expense guidance is unchanged 2015 FY…
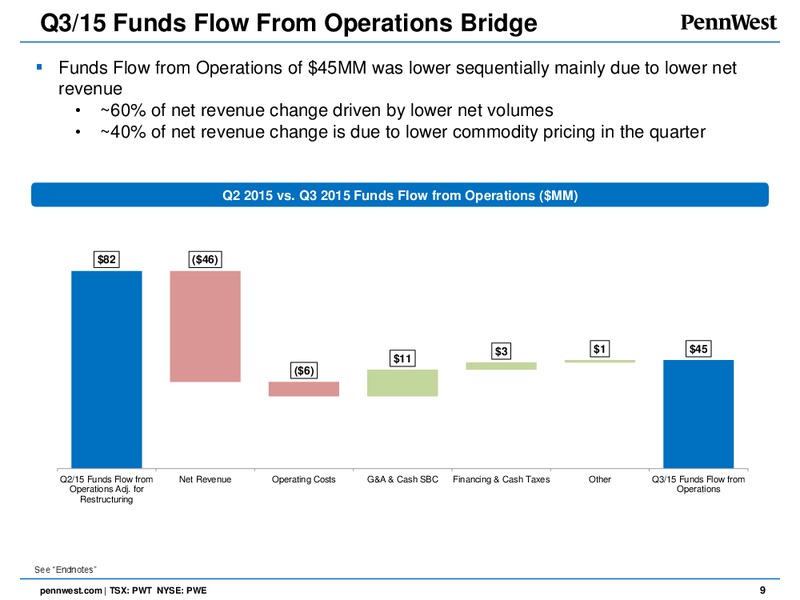
Q3/15 Funds Flow From Operations Bridge Funds Flow from Operations of 45MM was lower sequentially mainly due to lower net revenue 60% of net revenue change driven by lower net volumes 40% of net revenue change is due to lower…
Operated Development Activity Drilled 33 Dodsland wells in Q3 2015; expect to Continuing Focus in continue 1 rig pace Core Cardium and Viking Running 2 rigs in Cardium; expected to complete current pads by mid-November…
 Loading...