MANAGEMENTS DISCUSSION AND ANALYSIS FOR THE QUARTER ENDED SEPTEMBER 30, 2014 AND 2013
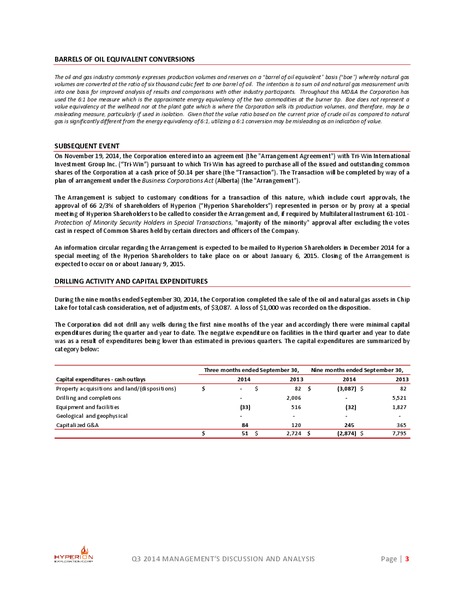
BARRELS OF OIL EQUIVALENT CONVERSIONS The oil and gas industry commonly expresses production volumes and reserves on a barrel of oil equivalent basis (boe) whereby natural gas volumes are converted at the ratio of six thousand cubic feet…
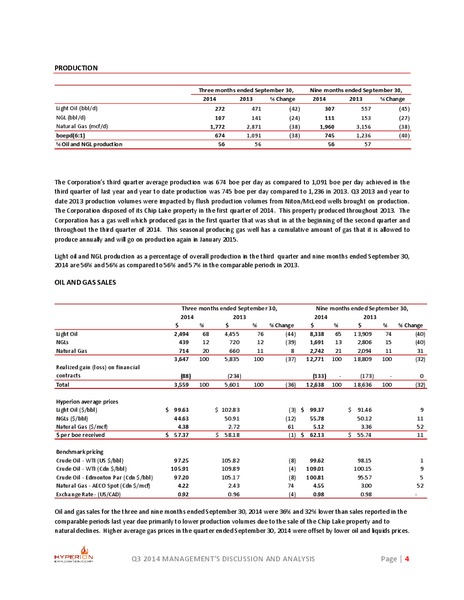
PRODUCTION Three months ended September 30, Nine months ended September 30, 2014 2013 % Change 2014 2013 % Change Light Oil (bbl/d) 272 471 (42) 307 557 (45) NGL (bbl/d) 107 141 (24) 111 153 (27) Natural Gas (mcf/d) 1,772 2,871 (38)…
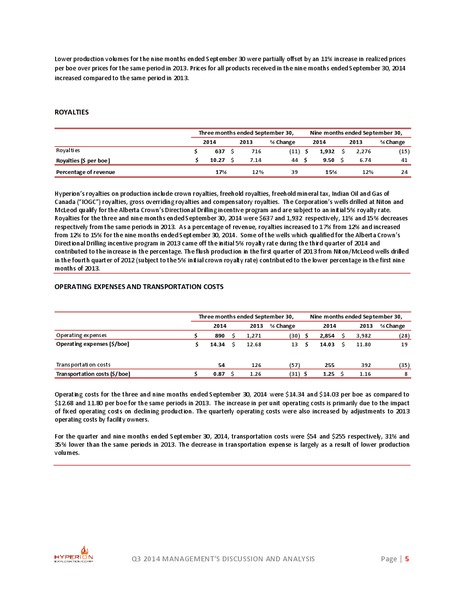
Lower production volumes for the nine months ended September 30 were partially offset by an 11% increase in realized prices per boe over prices for the same period in 2013. Prices for all products received in the nine months ended…
GENERAL & ADMINISTRATIVE (G&A) EXPENSES AND SHARE-BASED PAYMENTS Three months ended September 30, Nine months ended September 30, 2014 2013 % Change 2014 2013 % Change Gross costs 581 990 (41) 1,924 2,820 (32) Capitalized & recovered…
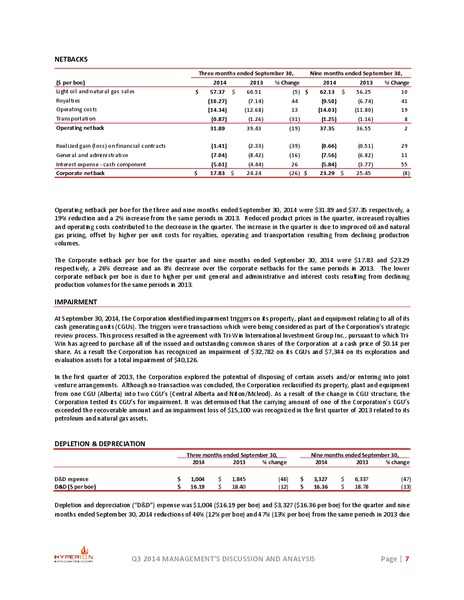
NETBACKS Three months ended September 30, Nine months ended September 30, ( per boe) 2014 2013 % Change 2014 2013 % Change Light oil and natural gas sales 57.37 60.51 (5) 62.13 56.25 10 Royalties (10.27) (7.14) 44 (9.50) (6.74) 41…
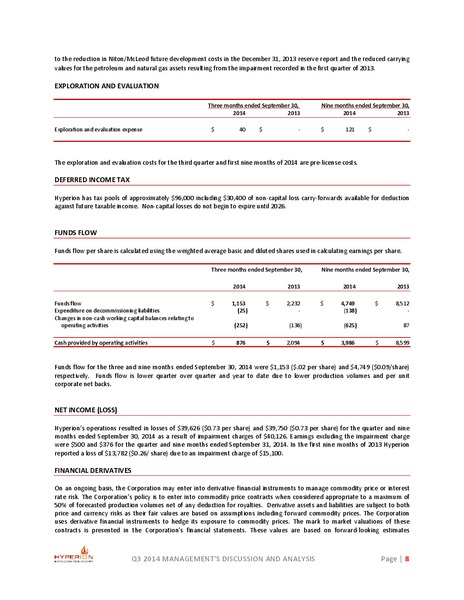
to the reduction in Niton/McLeod future development costs in the December 31, 2013 reserve report and the reduced carrying values for the petroleum and natural gas assets resulting from the impairment recorded in the first quarter of…
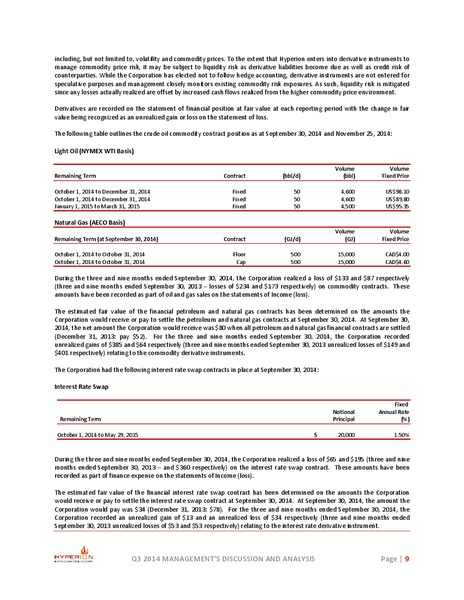
including, but not limited to, volatility and commodity prices. To the extent that Hyperion enters into derivative instruments to manage commodity price risk, it may be subject to liquidity risk as derivative liabilities become due as…
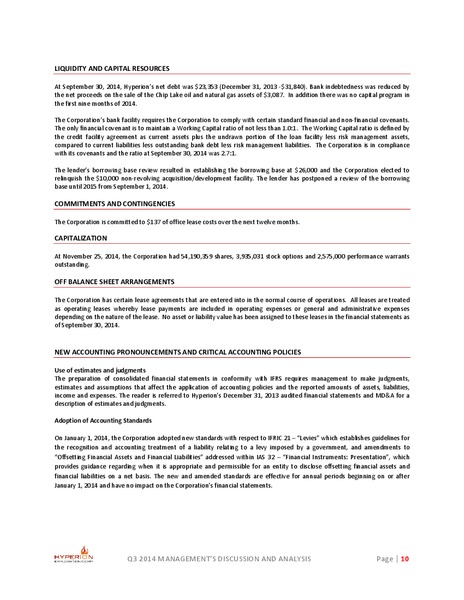
LIQUIDITY AND CAPITAL RESOURCES At September 30, 2014, Hyperions net debt was 23,353 (December 31, 2013 -31,840). Bank indebtedness was reduced by the net proceeds on the sale of the Chip Lake oil and natural gas assets of 3,087. In…
 Loading...