DOF Subsea Group In brief Fleet One of the largest subsea vessel owners in the world Owns and operates a fleet of 22 vessels, plus 4 newbuilds on order In addition 5 vessels on long-term charter The market value of owned vessels in…
DOF Subsea Group In brief Q3 last four years Key figures 5 last quarters 2 500 40% 35% 2 000 30% 25% NOK million 1 500 20% 1 000 15% 10% Key figures 500 5% Back-log incl. options NOK 40 billion Market value of fleet…
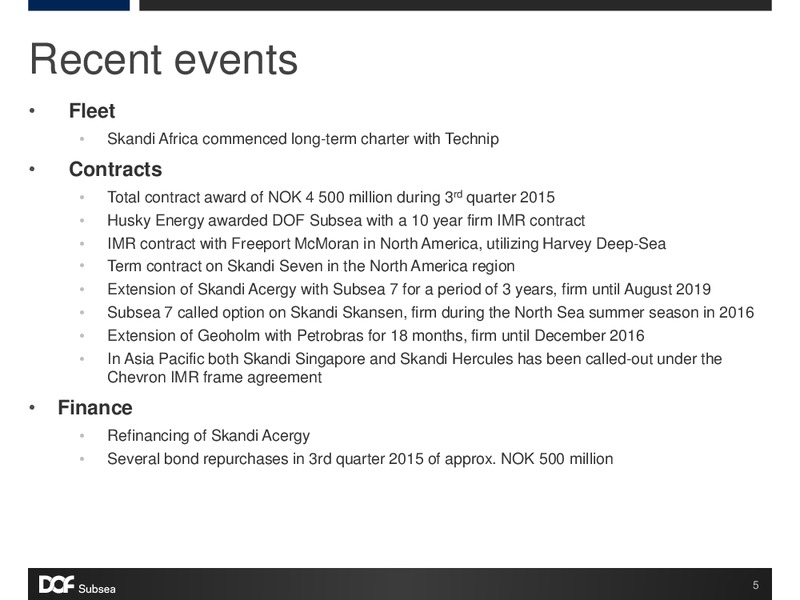
Recent events Fleet Skandi Africa commenced long-term charter with Technip Contracts Total contract award of NOK 4 500 million during 3rd quarter 2015 Husky Energy awarded DOF Subsea with a 10 year firm IMR contract IMR contract…
Ship of the Year 2015 Skandi Africa 6
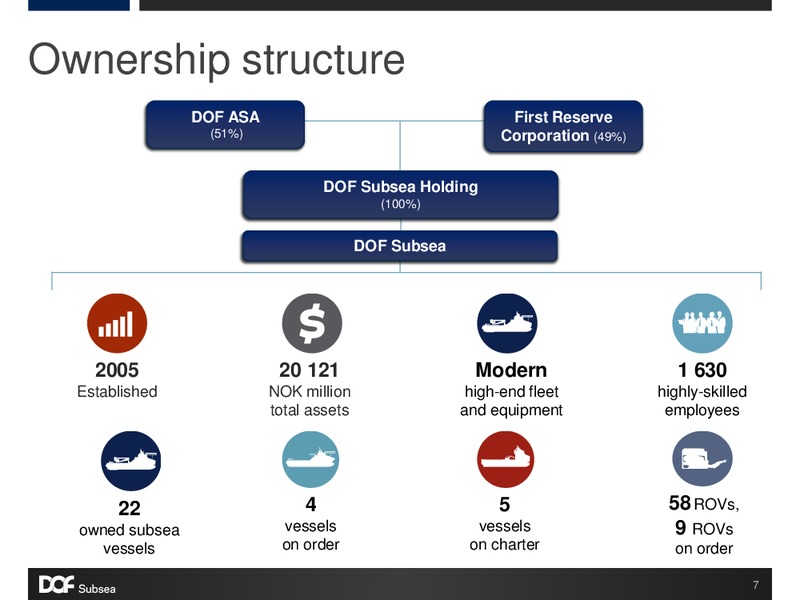
Ownership structure DOF ASA First Reserve (51%) Corporation (49%) DOF Subsea Holding (100%) DOF Subsea 2005 20 121 Modern 1 630 Established NOK million high-end fleet highly-skilled total assets and equipment…
Our global footprint Bergen Aberdeen St Johns 11 547 3 267 Houston ATLANTIC Manila NORTH AMERICA Brunei Kuala Lumpur Singapore 1 Luanda Jakarta Darwin Maca Rio de Janeiro 4 411 BRAZIL Perth Buenos ASIA PACIFIC Aires…
DOF Subsea timeline DOF Subsea fleet evolution DOF Subsea employees 28 18 000 2 000 Number of operated vessels MV of fleet 16 000 1 800 24 Number of employees 14 000 1 600 20 1 400 NOK million 12 000 16 1 200 10…
New high-end fleet 10,00 Year of delivery DOF Subsea fleet 9,00 Before 2000 4% Newbuild 8,00 15 % 7,00 2000 - 2006 6,00 23 % 5,00 4,00 3,00 2007 - 2015 58 % 2,00 1,00 - Average fleet age Value adjusted Majority of…
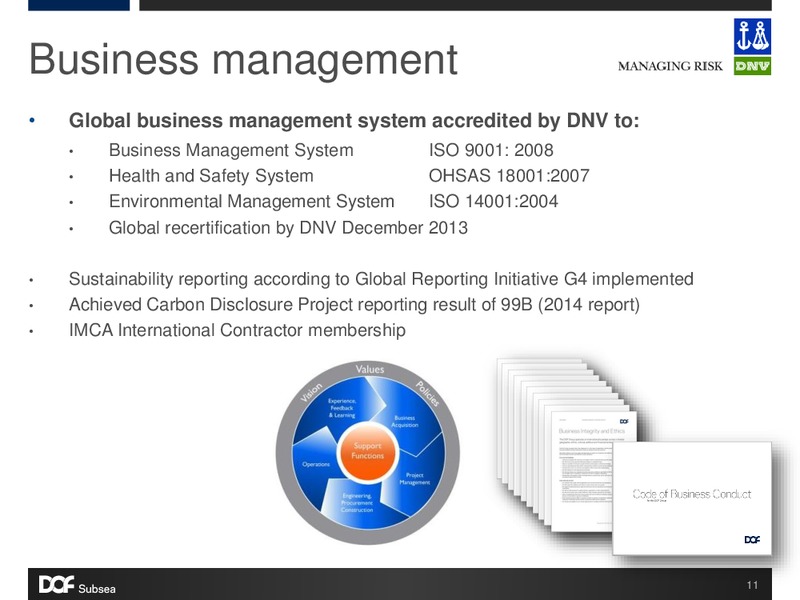
Business management Global business management system accredited by DNV to: Business Management System ISO 9001: 2008 Health and Safety System OHSAS 18001:2007 Environmental Management System ISO 14001:2004 Global recertification by…
HSEQ key statistcs Substantial HSE-improvement since 2005 Substantial increase in activity level measured by total man-hours DOF Subsea HSEQ-statistics 12 6 000 000 10 5 000 000 Frequence: Incident / 1 000 000 man-hour 8 4…
Projects
DOF Subsea Projects Operating income by segment DOF Subsea has built a global 8 000 2 500 presence over the last 10 years 7 000 2 000 DOF Subsea has developed the 6 000 project business gradually 5 000 1 500 NOK million…
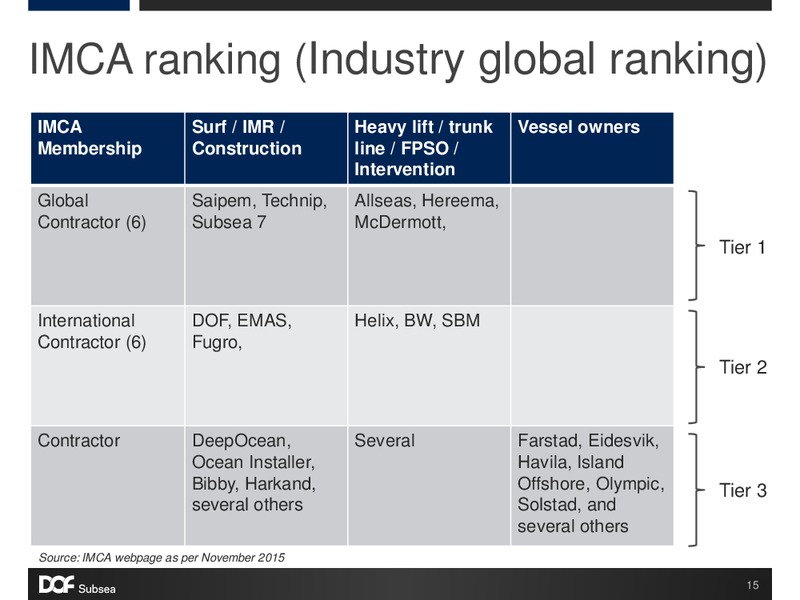
IMCA ranking (Industry global ranking) IMCA Surf / IMR / Heavy lift / trunk Vessel owners Membership Construction line / FPSO / Intervention Global Saipem, Technip, Allseas, Hereema, Contractor (6) Subsea 7 McDermott, Tier 1…
Establishing the North America region Targeted establishment in North America market from 2012 Mainly focus on delivering S&P services and obtaining MSAs/FAs Built track record of subsea projects gradually Built a fleet of 3…
Condensed profit & loss (IFRS 11) Operating income was NOK 1 904 million in Q3 2015, up from NOK 1 815 million in Q3 2014. EBITDA (excl. gain on sale of assets) was NOK 452 million in Q3 2015, down from NOK 496 million in Q3…
Condensed balance sheet (IFRS 11) From year end 2014 non-current assets has increased to NOK 15 086 million from NOK 14 336 million From year end 2014 total receivables has increased to NOK 1 980 million from NOK 1 964 million…
Debt maturity profile Debt maturity profile DOF Subsea AS level, 2016E 2020E 3 000 DOFSUB05 - NOK 750 million - Maturity April 2016 2 500 2 000 DOFSUB07 - NOK 1 300 million - Maturity May 2018 1 500 1 000 500 - 2016E…
Risk mitigating factors New, high-end fleet provides Value added safe collateral services provide Recent sale of increased vessels earnings potential Diversified blue- Spare leveraging chip customers capacity on reduce…
Outlook
Challenging fundamentals for subsea activity Demand Weak and volatile oil price Continued cost focus by oil companies Reduced offshore E&P spending Uncertain project timing Increased focus on newer, technologically advanced and…
Challenging fundamentals for subsea activity Supply Fleet of subsea vessels increasing Several vessels in lay-up Increasing supply of engineering capabilities Reduced Increasing demand supply Weaker market conditions…
Challenging fundamentals for subsea activity Low and volatile oil price Increased Reduced supply of E&P subsea spending vessels Lower rig Improved activity and access to delayed field qualified development personnel Weak…
 Loading...