3rd Quarter 2015 Earnings Webcast November 6, 2015
Q3 2015 Results Highlights Revenues of Ps 40.9 billion (+7.1%); YTD +10.5% Adj. EBITDA(1) reached Ps 13.4 billion (-1.8%); YTD +9.1% Operating Income was Ps 5.6 billion (-30.0%); YTD -14.7% Total Capex was Ps 15.7 billion…
Q3 2015 Results Expressed in US Dollars Despite lower prices across most products, results were solid and in line with budget; difficult comparison against spectacular Q3 2014 Revenues (1) Adj. EBITDA (1) (2) Operating Income (1)…
Q3 2015 Quarterly evolution in US Dollars This quarters Adj.EBITDA was the second best in history Revenues (1) Adj. EBITDA (1) (2) (in millions of USD) (in millions of USD) 1,649 4,632 4,413 4,459 4,443 4,448 4,355 1,452…
Q3 2015 Operating Income Decrease in Operating Income was mostly concentrated in the Upstream segment (in millions of Ps) 8,044 221 5,631 -2,292 -342 Q3 2014 Corporate & Others Upstream Downstream Q3 2015 7
Q3 2015 Operating Income Higher DD&A, purchases and exploration expenses resulted in a decrease in Operating Income of 30% (in millions of Ps) 2,722 49 8,044 -1,552 -1,407 -1,261 5,631 -876 -88 Q3 2014 Revenues Other…
Q3 2015 Upstream Results Upstream Operating Income declined 51% to Ps 2.2 billion as cost increases outpaced price increases, with flat production (In million of Ps) 1,134 100 4,463 -1,405 -1,039 2,171 -876 -206 Q3 2014…
Q3 2015 Upstream Results Production Total production was flat with 1.3% growth in crude oil and 1.4% decline in natural gas; swap of areas in production and operating challenges in non-operated areas were the main reasons for…
Q3 2015 Upstream Results Shale Update Horizontal well type vs adjusted real production 120.000 Type Well Curve - 18 Frac stages - EUR 566 Bbl GOR 120 m3/m3 LLL-0992 - 28 Frac stages SOil-0027 - 13 Frac stages SOil-0030 - 18 Frac…
Q3 2015 Upstream Results Tight Gas Update Tight gas production Loma La Lata Rincn del Mangrullo (121 km2 29,900 acres)(1) (183 km2 - 45,200 acres) in Q3 2015 represented Objective: Lajas formation Objective: Mulichinco formation 12%…
Q3 2015 Downstream Results Downstream Operating Income declined 9%. Lower international prices resulted in a reduction in exports, but local sales were strong across most products. (in millions of Ps) 218 74 933 3,864 -795…
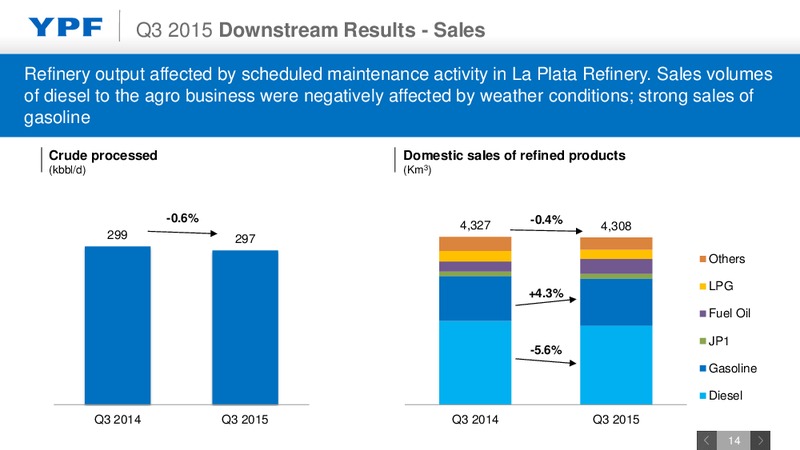
Q3 2015 Downstream Results - Sales Refinery output affected by scheduled maintenance activity in La Plata Refinery. Sales volumes of diesel to the agro business were negatively affected by weather conditions; strong sales of gasoline…
Q3 2015 Downstream Results Demand Gasoline sales consistently above 2014; diesel is flat YTD despite a difficult month of August Monthly Gasoline Sales (Km3) Monthly Diesel Sales (Km3) 2015 800 2015 440 + 4.3% 2014 +-0.8% 5.6%…
Q3 2015 Capex (in millions of Ps) Upstream Upstream Downstream Others +14.1% Neuquina basin: Loma Campana, Aguada 15,730 Toledo, Rincn del Mangrullo, El Orejano, 13,787 Chachahuen and La Amarga Chica. Golfo San Jorge basin:…
Q3 2015 Cash Flow From Operations Strong cash position at the end of Q3 2015 despite lower cash flow from operations Difficult comparison with one-off Q3 2014 Consolidated statement of cash flows Cash flow from operations (in…
Financial Situation Update(1) Cash position covers debt maturities for next 12 months. Continued to extend the average life of debt. Financial debt amortization schedule (1) (2) (in millions of USD) Debt profile highlights Peso…
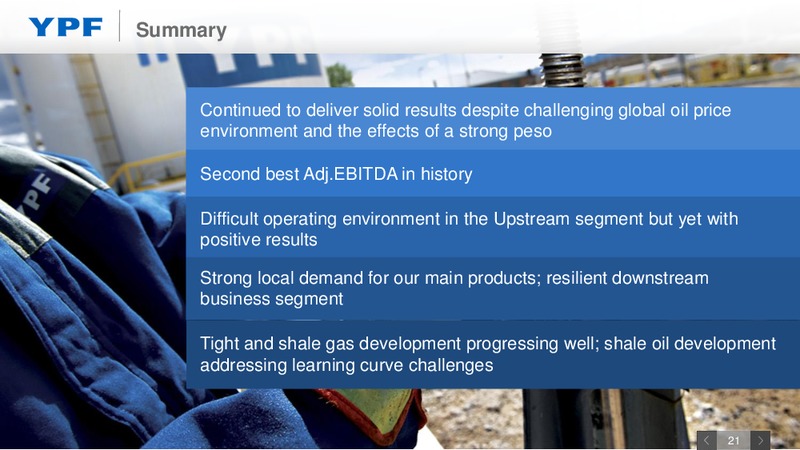
Summary Continued to deliver solid results despite challenging global oil price environment and the effects of a strong peso Second best Adj.EBITDA in history Difficult operating environment in the Upstream segment but yet with…
 Loading...