Safe Harbor T his presentation contains both historical and forward-looking statements. These forward-looking statements are not based on historical facts, but rather reflect our current expectations concerning future results and…
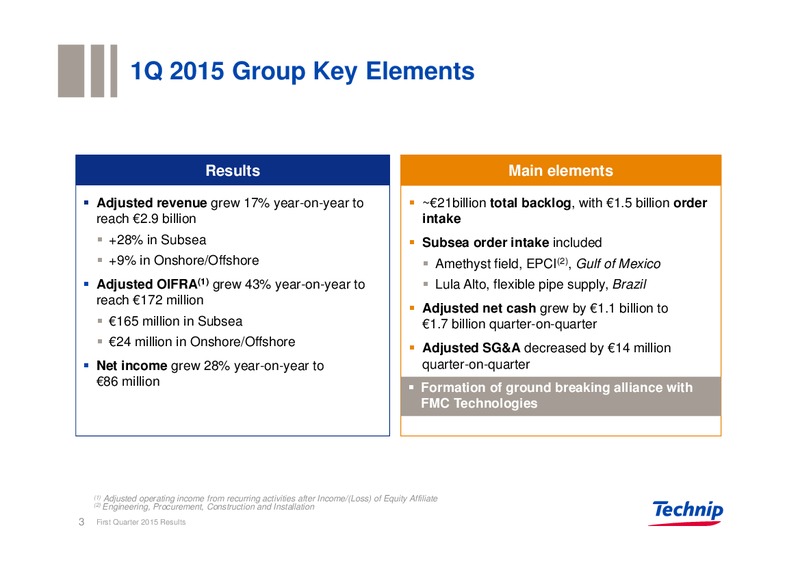
1Q 2015 Group Key Elements Results Main elements Adjusted revenue grew 17% year-on-year to 21billion total backlog, with 1.5 billion order reach 2.9 billion intake +28% in Subsea Subsea order intake included +9% in…
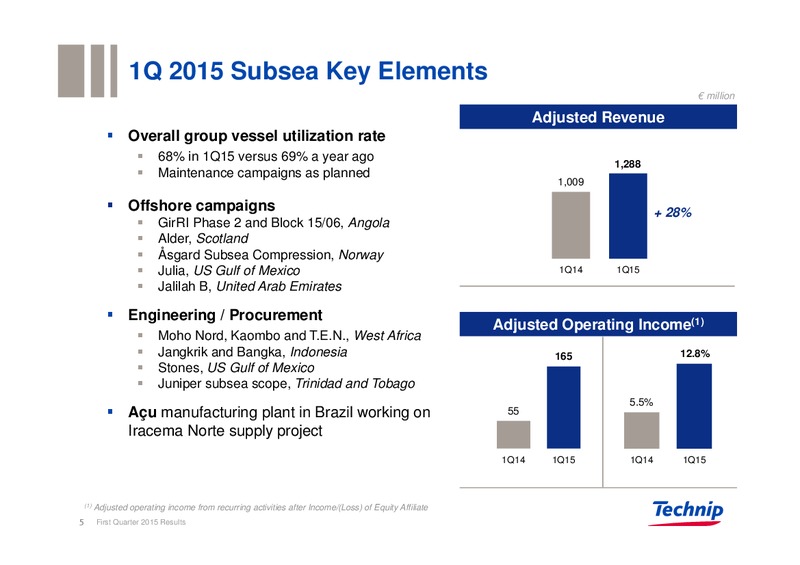
1Q 2015 Subsea Key Elements million Adjusted Revenue Overall group vessel utilization rate 68% in 1Q15 versus 69% a year ago 1,288 Maintenance campaigns as planned 1,009 Offshore campaigns + 28% GirRI Phase 2 and Block 15/06,…
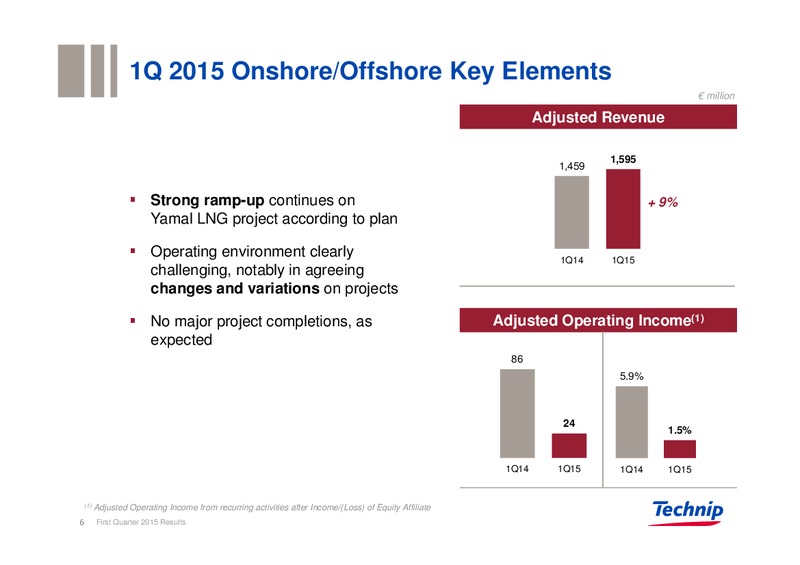
1Q 2015 Onshore/Offshore Key Elements million Adjusted Revenue 1,595 1,459 Strong ramp-up continues on + 9% Yamal LNG project according to plan Operating environment clearly 1Q14 1Q15 challenging, notably in agreeing…
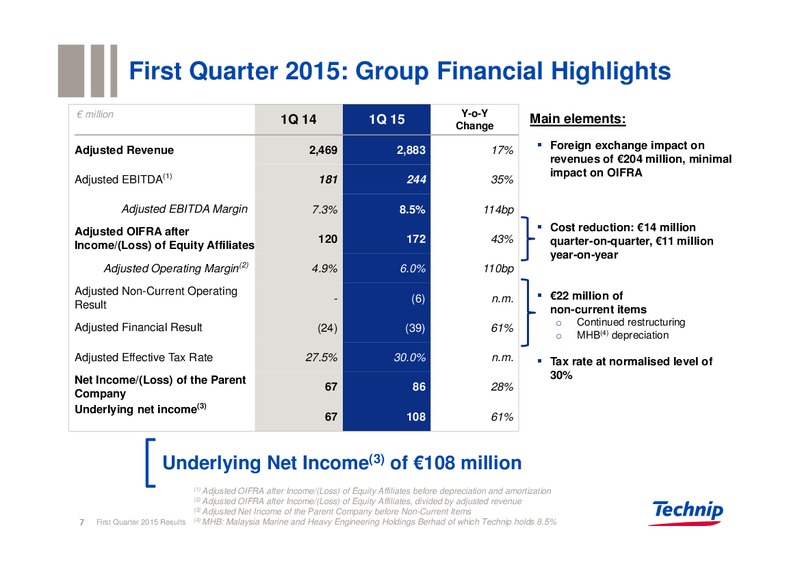
First Quarter 2015: Group Financial Highlights million Y-o-Y 1Q 14 1Q 15 Change Main elements: Adjusted Revenue 2,469 2,883 17% Foreign exchange impact on revenues of 204 million, minimal impact on OIFRA Adjusted EBITDA(1) 181 244…
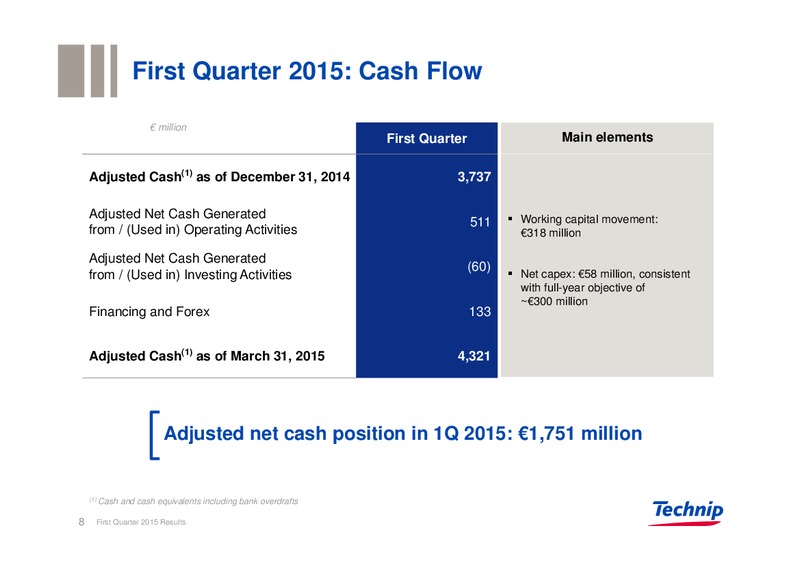
First Quarter 2015: Cash Flow million Mainelements elements First Quarter Main Adjusted Cash(1) as of December 31, 2014 3,737 Adjusted Net Cash Generated Working capital movement: 511 from / (Used in) Operating Activities 318…
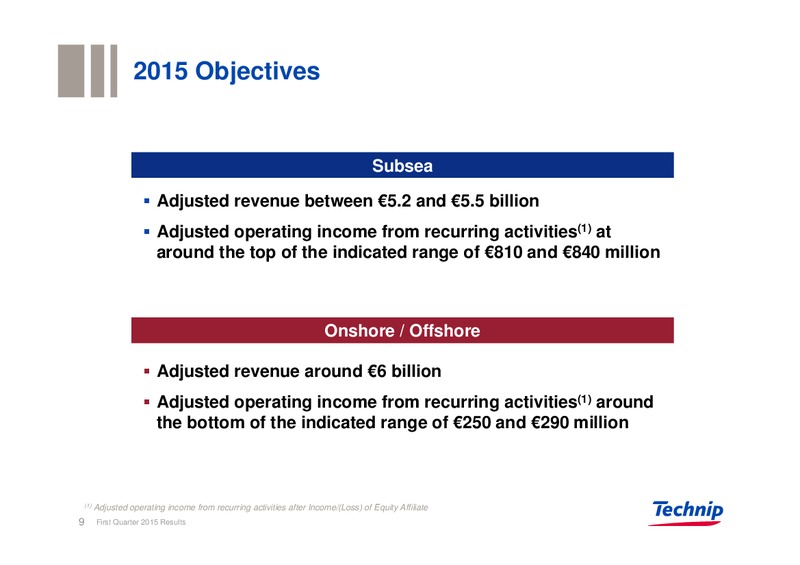
2015 Objectives Subsea Adjusted revenue between 5.2 and 5.5 billion Adjusted operating income from recurring activities(1) at around the top of the indicated range of 810 and 840 million Onshore / Offshore Adjusted revenue…
Technip in the Current Market Environment 10 First Quarter 2015 Results
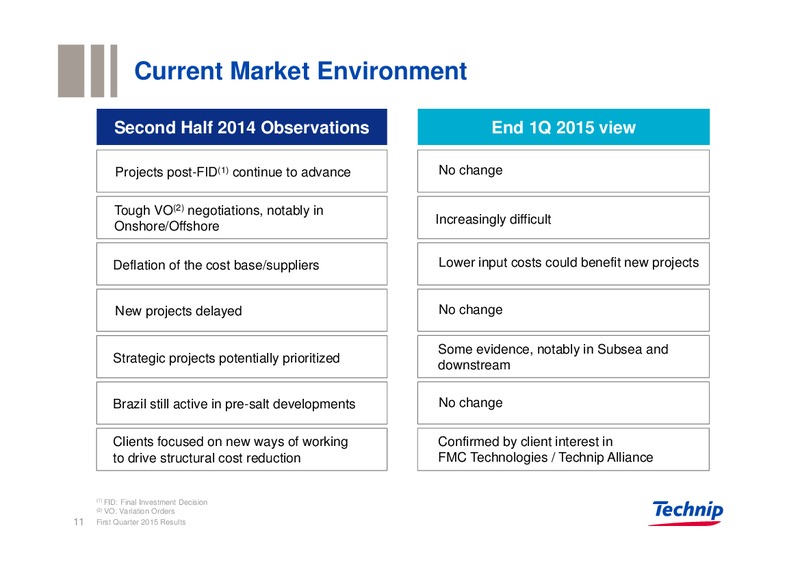
Current Market Environment Second Half 2014 Observations End 1Q 2015 view Projects post-FID(1) continue to advance No change Tough VO(2) negotiations, notably in Increasingly difficult Onshore/Offshore Deflation of the cost…
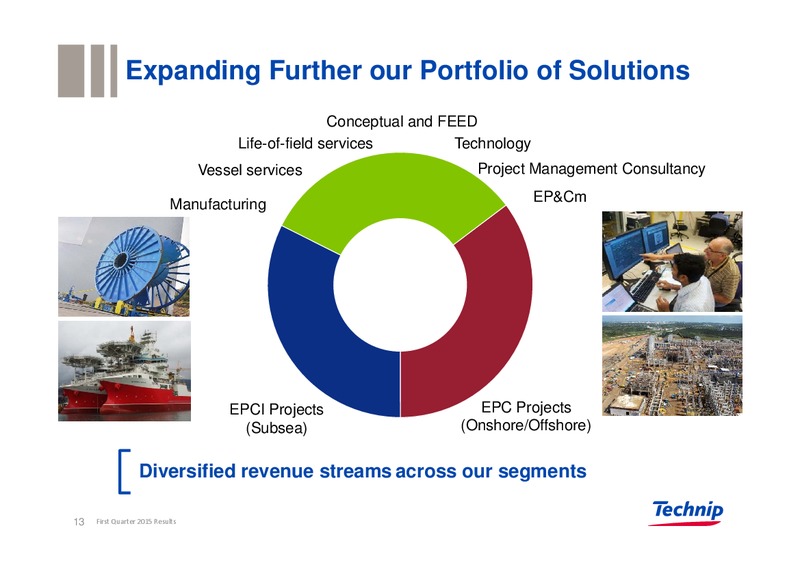
Expanding Further our Portfolio of Solutions Conceptual and FEED Life-of-field services Technology Vessel services Project Management Consultancy EP&Cm Manufacturing EPCI Projects EPC Projects (Subsea) (Onshore/Offshore)…
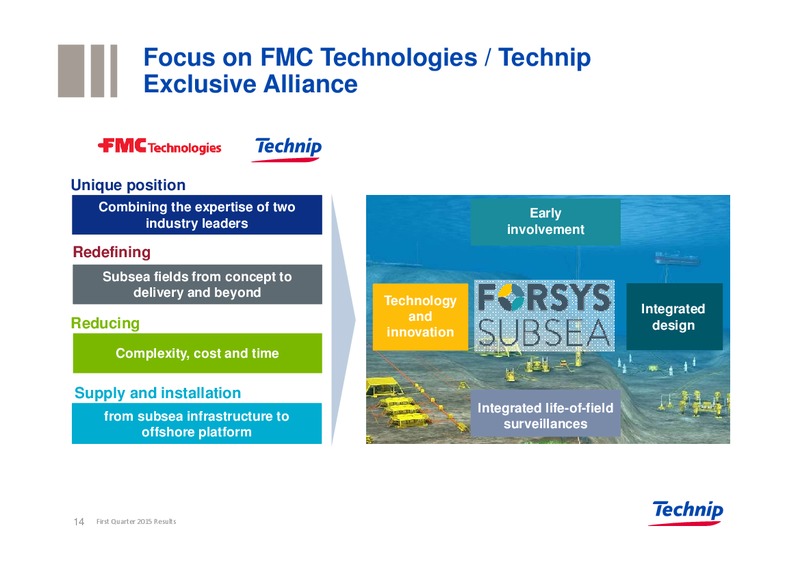
Focus on FMC Technologies / Technip Exclusive Alliance Unique position Combining the expertise of two Early industry leaders involvement Redefining Subsea fields from concept to delivery and beyond Technology Integrated and…
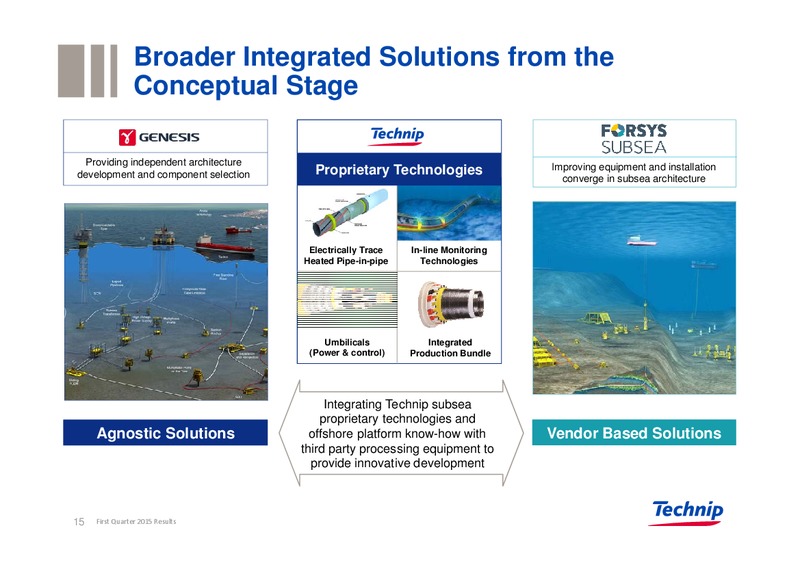
Broader Integrated Solutions from the Conceptual Stage Providing independent architecture Improving equipment and installation development and component selection Proprietary Technologies converge in subsea architecture…
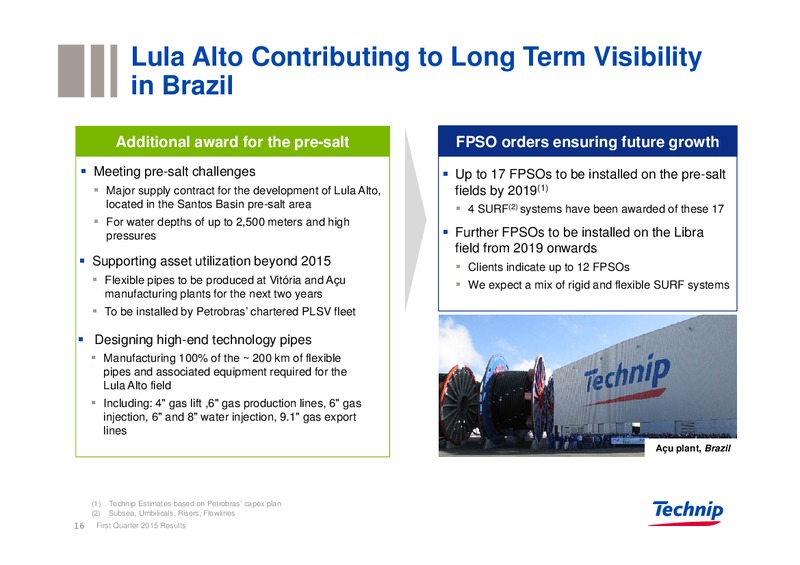
Lula Alto Contributing to Long Term Visibility in Brazil Additional award for the pre-salt FPSO orders ensuring future growth Meeting pre-salt challenges Up to 17 FPSOs to be installed on the pre-salt Major supply contract for the…
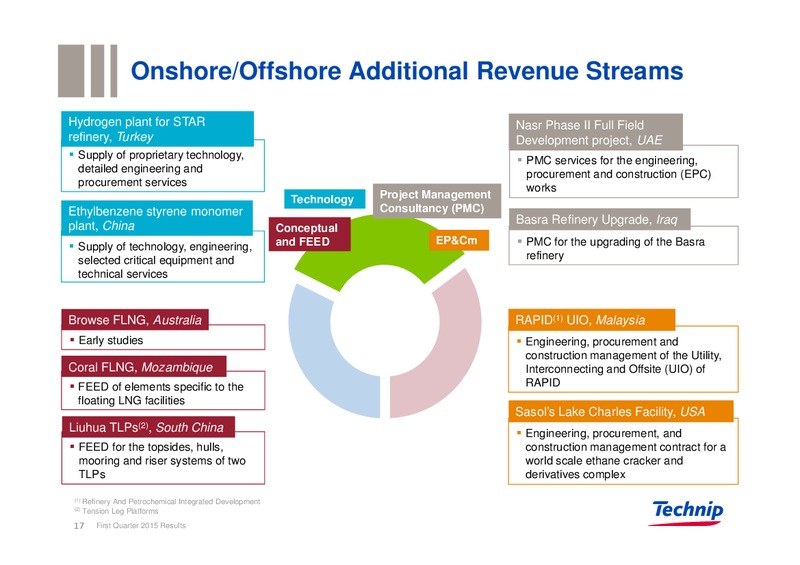
Onshore/Offshore Additional Revenue Streams Hydrogen plant for STAR Nasr Phase II Full Field refinery, Turkey Development project, UAE Supply of proprietary technology, PMC services for the engineering, detailed engineering and…
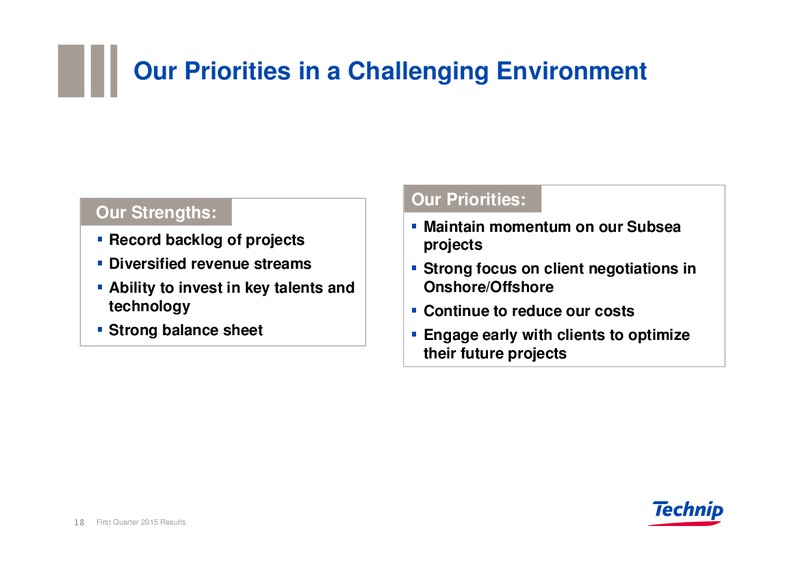
Our Priorities in a Challenging Environment Our Priorities: Our Strengths: Maintain momentum on our Subsea Record backlog of projects projects Diversified revenue streams Strong focus on client negotiations in Ability to invest…
Thank you Paris, April 23, 2015
Annex
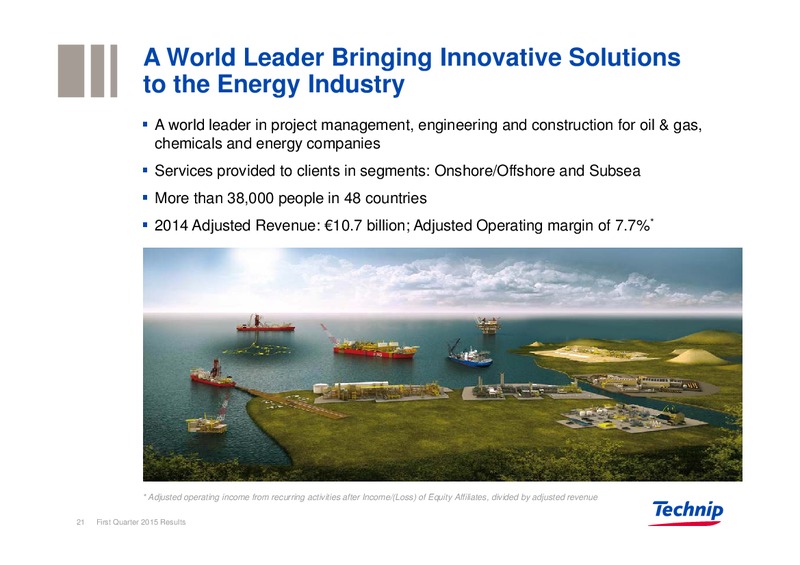
A World Leader Bringing Innovative Solutions to the Energy Industry A world leader in project management, engineering and construction for oil & gas, chemicals and energy companies Services provided to clients in segments:…
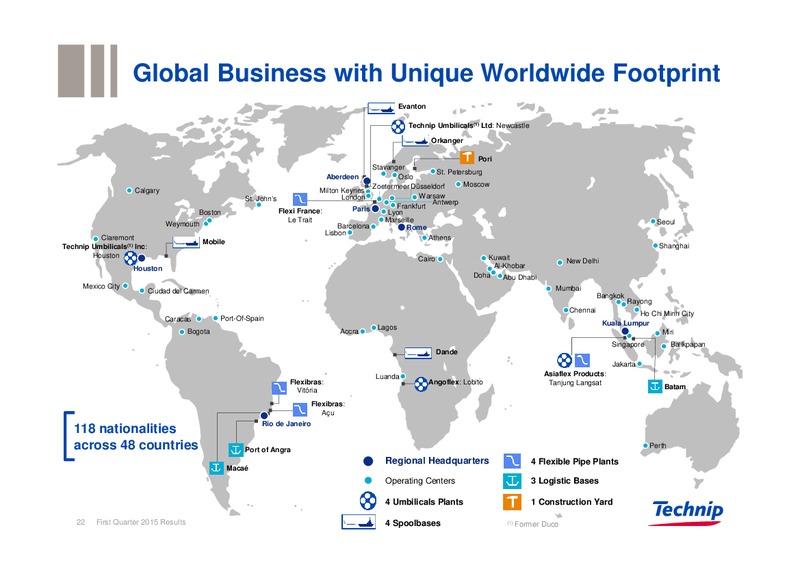
Global Business with Unique Worldwide Footprint Evanton Technip Umbilicals(1) Ltd: Newcastle Orkanger Pori Stavanger St. Petersburg Aberdeen Oslo Zoetermeer Dsseldorf Moscow Calgary Milton Keynes St. Johns London Warsaw…
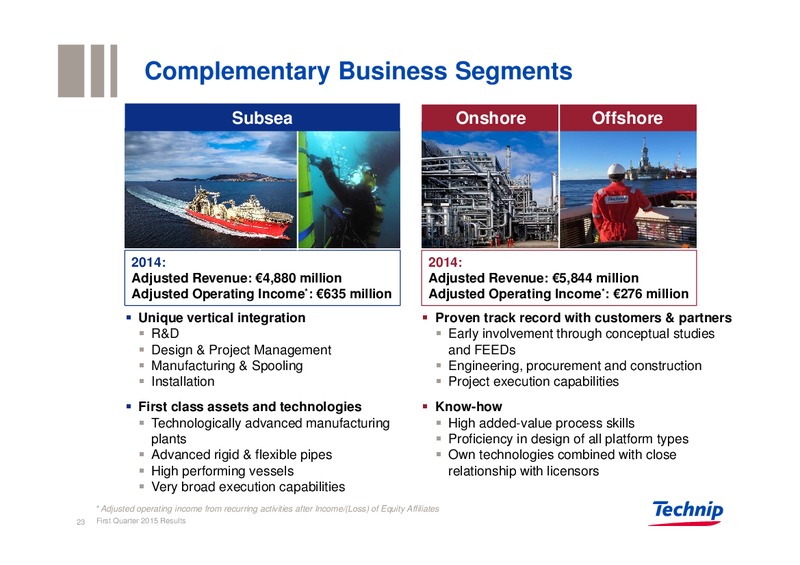
Complementary Business Segments Subsea Onshore Offshore 2014: 2014: Adjusted Revenue: 4,880 million Adjusted Revenue: 5,844 million Adjusted Operating Income*: 635 million Adjusted Operating Income*: 276 million Unique vertical…
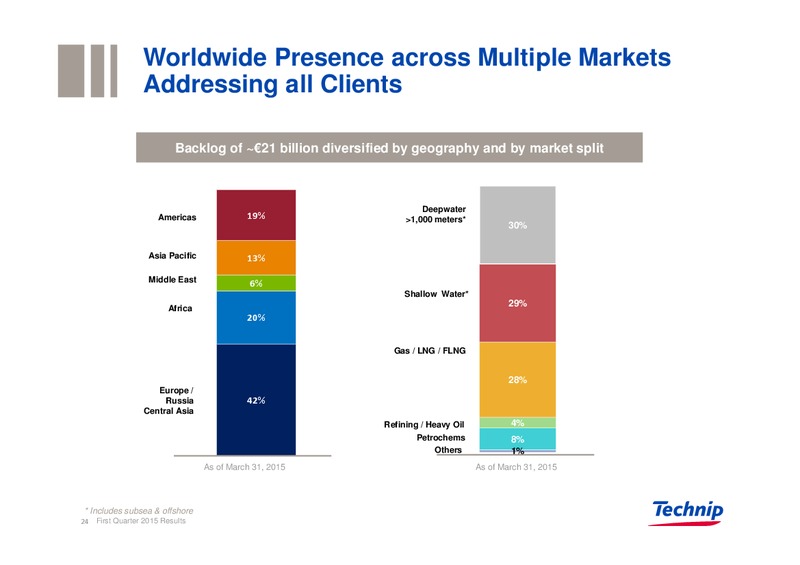
Worldwide Presence across Multiple Markets Addressing all Clients Backlog of 21 billion diversified by geography and by market split Deepwater Americas 19% 1,000 meters* 30% Asia Pacific 13% Middle East 6% Shallow Water*…
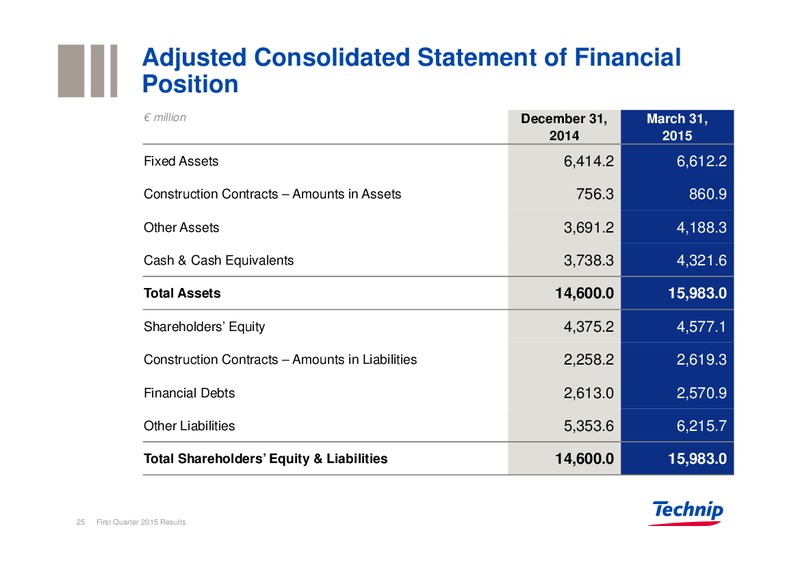
Adjusted Consolidated Statement of Financial Position million December 31, March 31, 2014 2015 Fixed Assets 6,414.2 6,612.2 Construction Contracts Amounts in Assets 756.3 860.9 Other Assets 3,691.2 4,188.3 Cash & Cash…
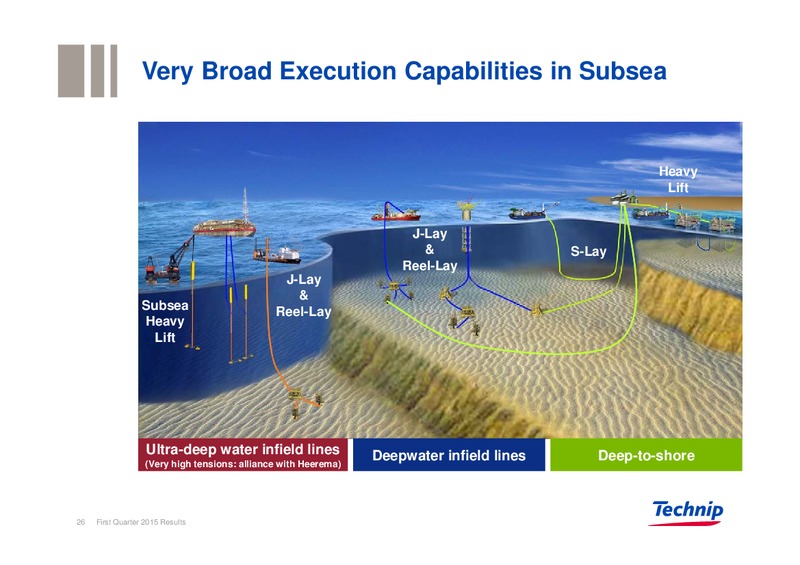
Very Broad Execution Capabilities in Subsea Heavy Lift J-Lay & S-Lay Reel-Lay J-Lay & Subsea Reel-Lay Heavy Lift Ultra-deep water infield lines Deepwater infield lines Deep-to-shore (Very high tensions: alliance with…
Differentiation Through Genesis Provide independent decision support from pre-feasibility, through feasibility, concept selection and pre-FEED Over 1,500 dedicated Engineers and Designers Delivering Fit-for-Purpose Solutions for…
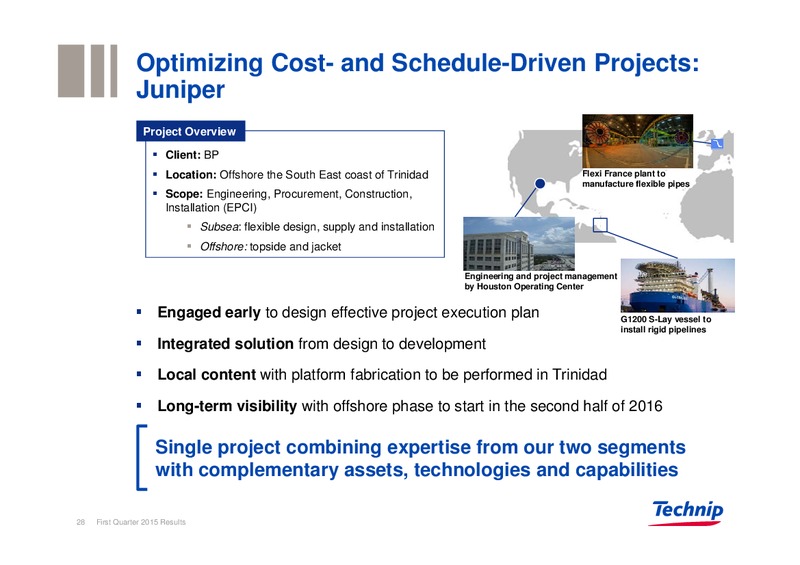
Optimizing Cost- and Schedule-Driven Projects: Juniper Project Overview Client: BP Location: Offshore the South East coast of Trinidad Flexi France plant to manufacture flexible pipes Scope: Engineering, Procurement,…
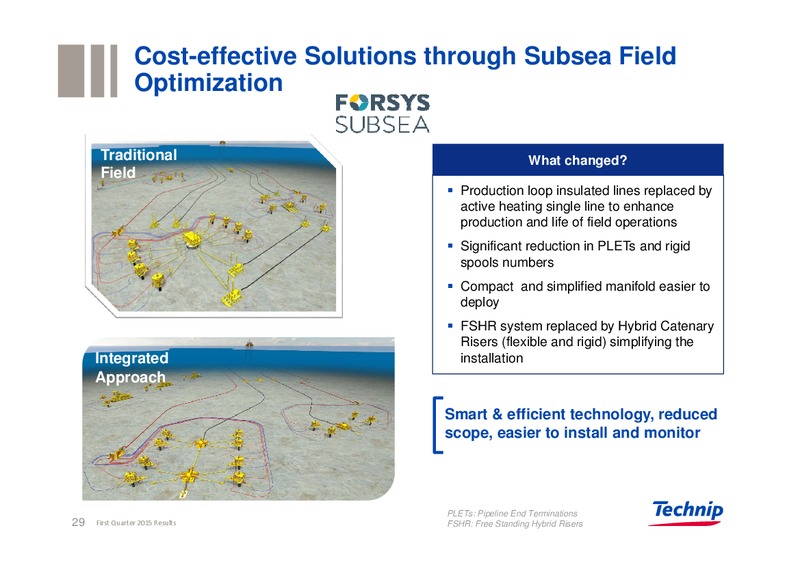
Cost-effective Solutions through Subsea Field Optimization Traditional What changed Field Production loop insulated lines replaced by active heating single line to enhance production and life of field operations Significant…
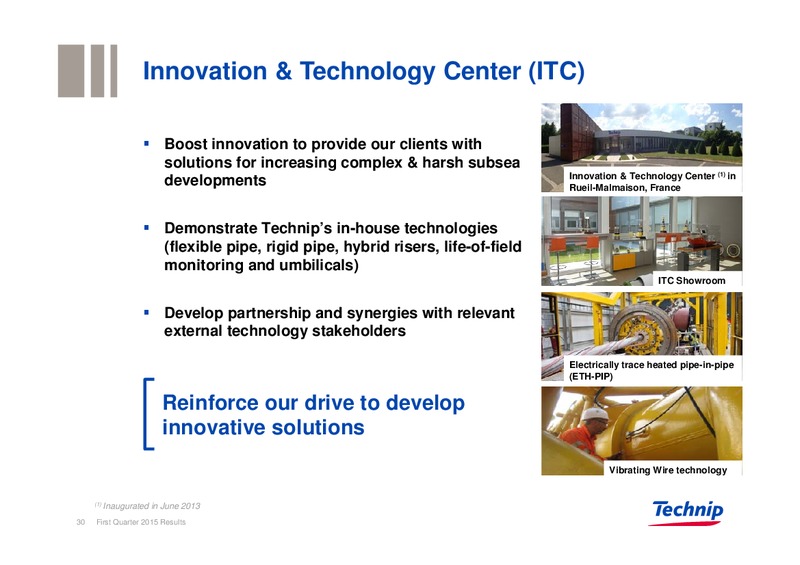
Innovation & Technology Center (ITC) Boost innovation to provide our clients with solutions for increasing complex & harsh subsea Innovation & Technology Center (1) in developments Rueil-Malmaison, France Demonstrate Technips…
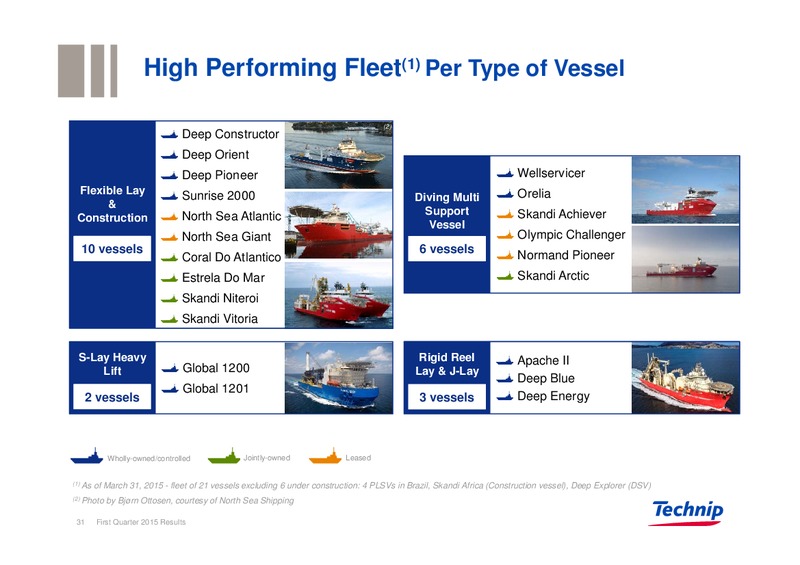
High Performing Fleet(1) Per Type of Vessel (2) Deep Constructor Deep Orient Deep Pioneer Wellservicer Flexible Lay Sunrise 2000 Orelia Diving Multi & North Sea Atlantic Support Skandi Achiever Construction Vessel North Sea…
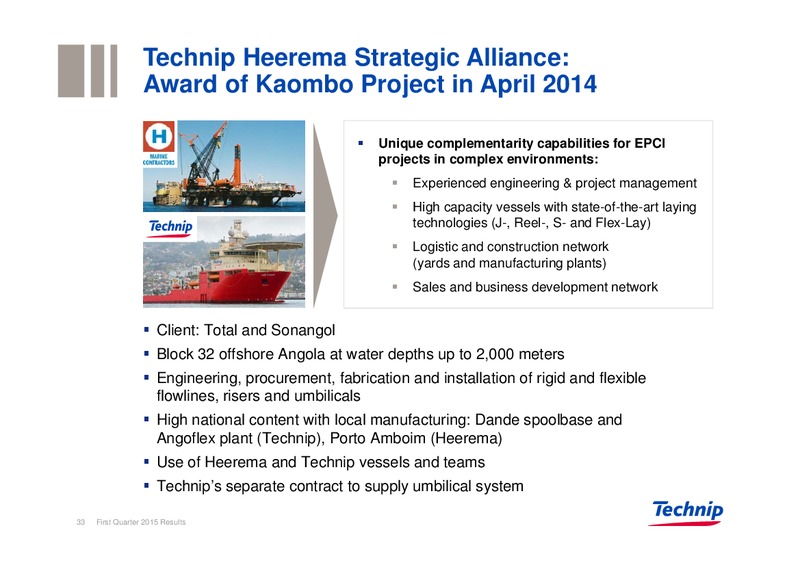
Technip Heerema Strategic Alliance: Award of Kaombo Project in April 2014 Unique complementarity capabilities for EPCI projects in complex environments: Experienced engineering & project management High capacity vessels with…
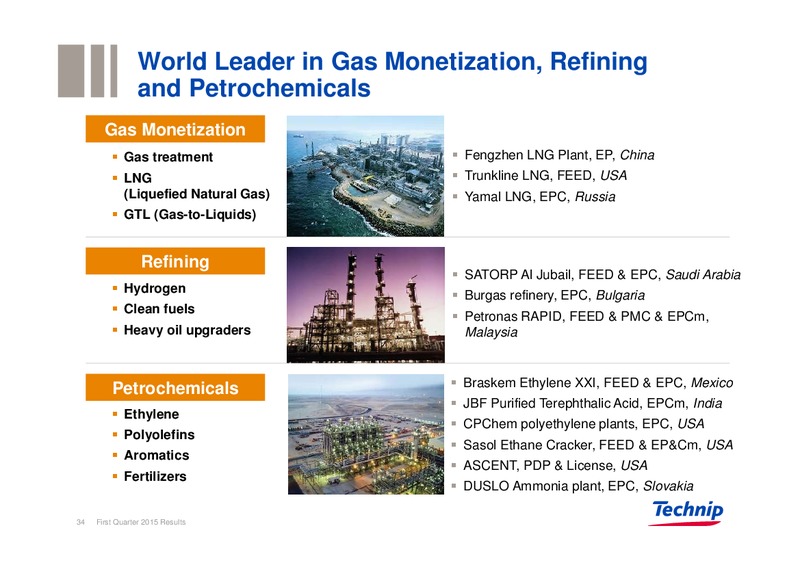
World Leader in Gas Monetization, Refining and Petrochemicals Gas Monetization Gas treatment Fengzhen LNG Plant, EP, China LNG Trunkline LNG, FEED, USA (Liquefied Natural Gas) Yamal LNG, EPC, Russia GTL (Gas-to-Liquids)…
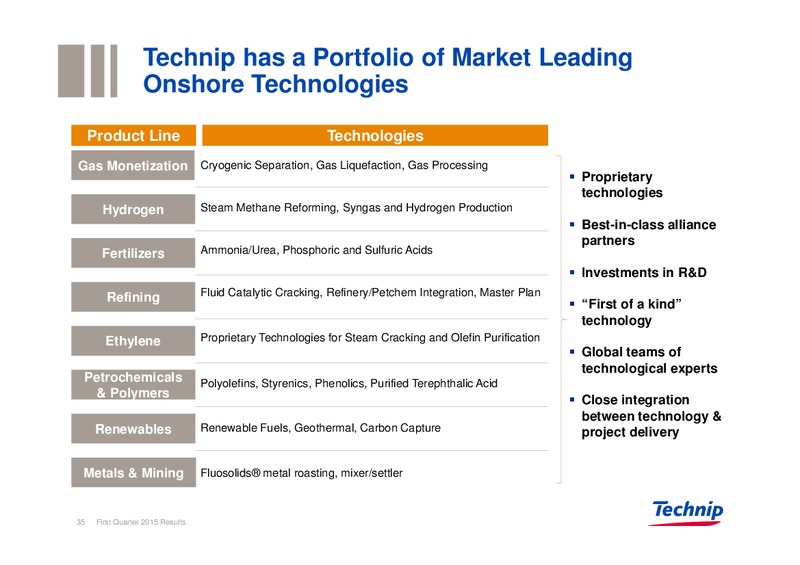
Technip has a Portfolio of Market Leading Onshore Technologies Product Line Technologies Gas Monetization Cryogenic Separation, Gas Liquefaction, Gas Processing Proprietary technologies Hydrogen Steam Methane Reforming, Syngas and…
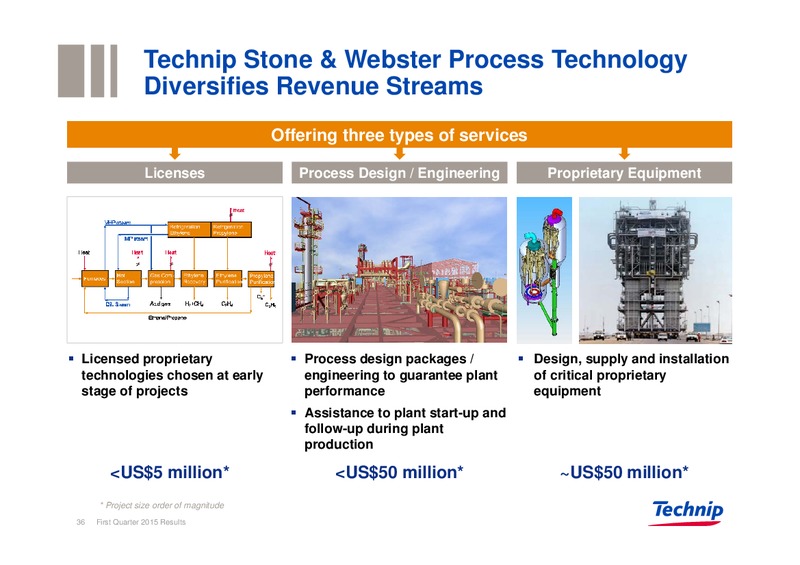
Technip Stone & Webster Process Technology Diversifies Revenue Streams Offering three types of services Licenses Process Design / Engineering Proprietary Equipment Licensed proprietary Process design packages / Design, supply…
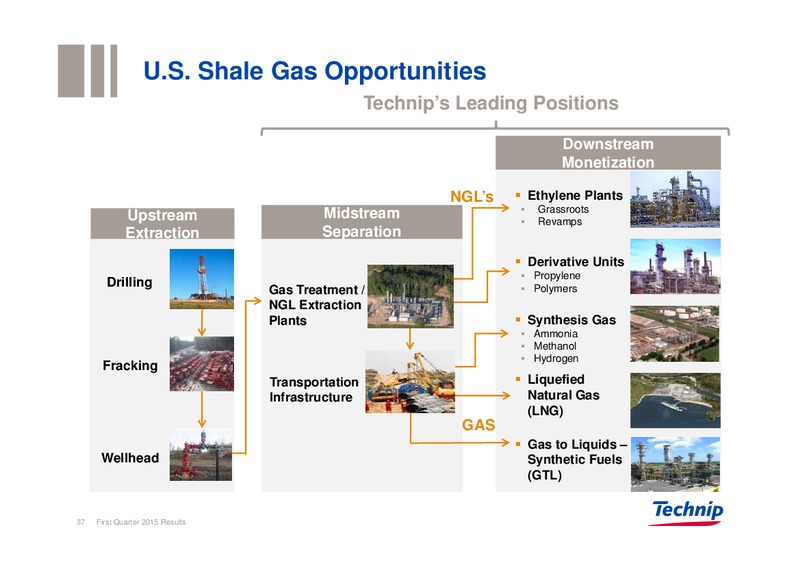
U.S. Shale Gas Opportunities Technips Leading Positions Downstream Monetization NGLs Ethylene Plants Grassroots Upstream Midstream Revamps Extraction Separation Derivative Units Propylene Drilling Polymers Gas Treatment /…
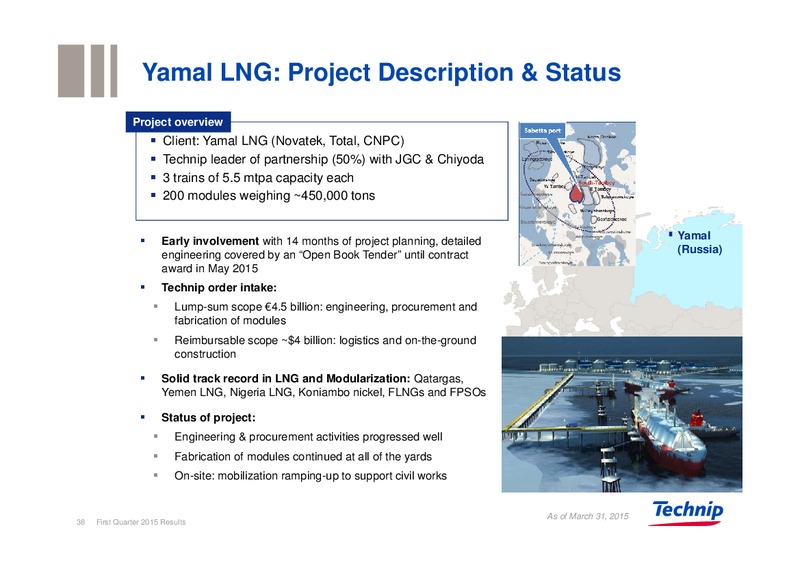
Yamal LNG: Project Description & Status Project overview Client: Yamal LNG (Novatek, Total, CNPC) Technip leader of partnership (50%) with JGC & Chiyoda 3 trains of 5.5 mtpa capacity each 200 modules weighing 450,000 tons Early…
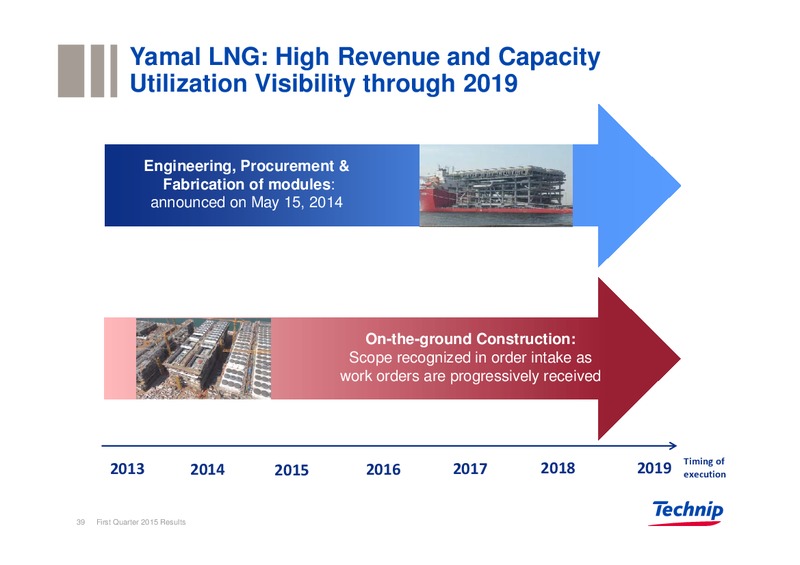
Yamal LNG: High Revenue and Capacity Utilization Visibility through 2019 Engineering, Procurement & Fabrication of modules: announced on May 15, 2014 On-the-ground Construction: Scope recognized in order intake as work…
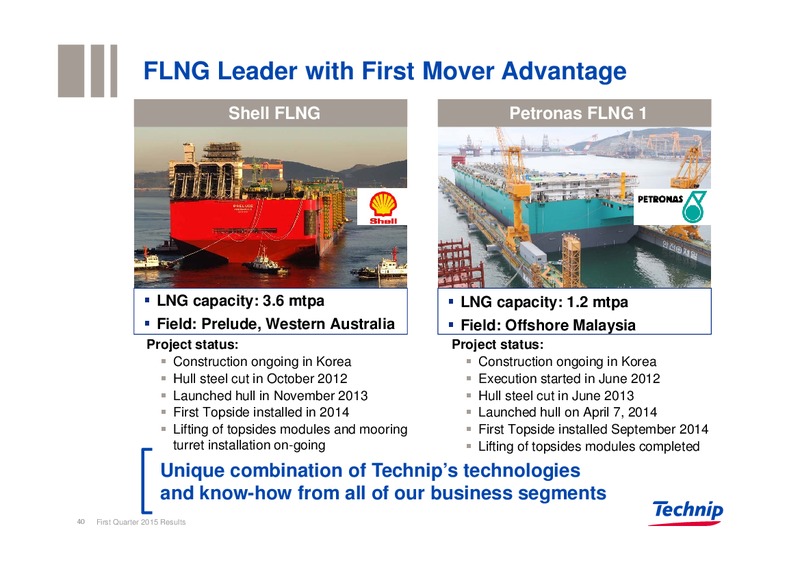
FLNG Leader with First Mover Advantage Shell FLNG Petronas FLNG 1 LNG capacity: 3.6 mtpa LNG capacity: 1.2 mtpa Field: Prelude, Western Australia Field: Offshore Malaysia Project status: Project status: Construction ongoing in…
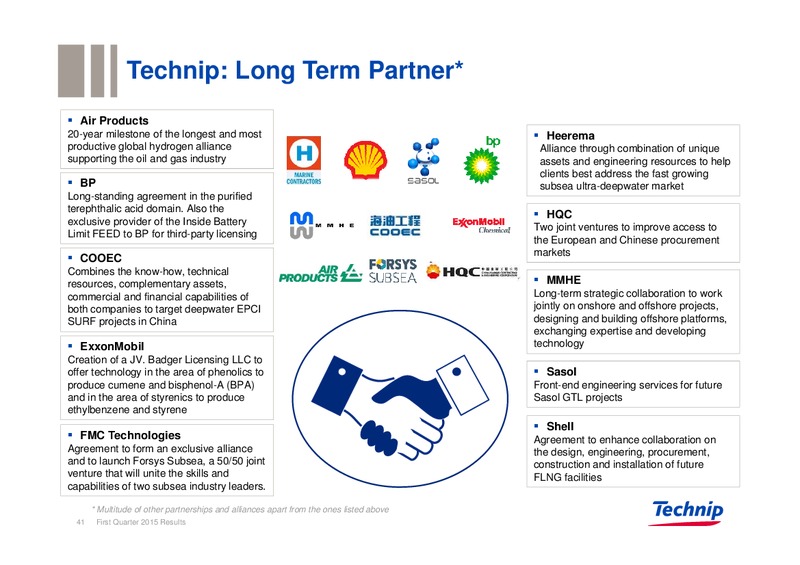
Technip: Long Term Partner* Air Products 20-year milestone of the longest and most Heerema productive global hydrogen alliance Alliance through combination of unique supporting the oil and gas industry assets and engineering resources…
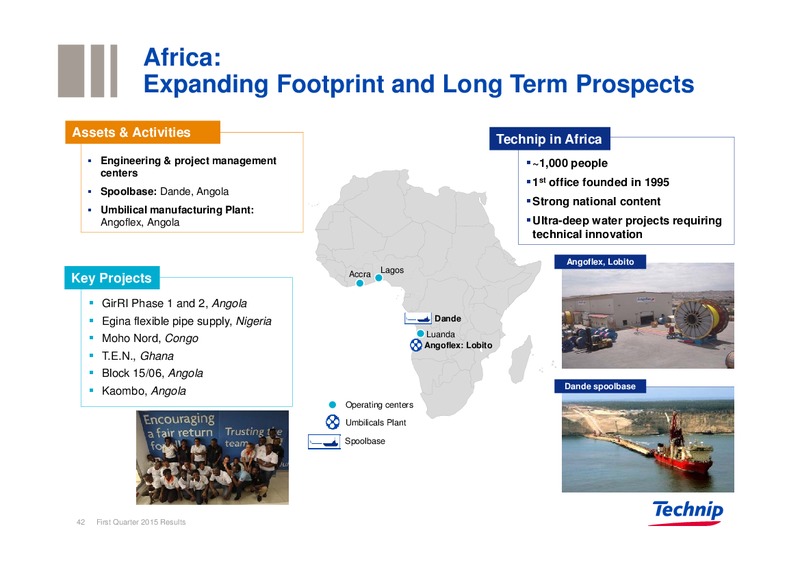
Africa: Expanding Footprint and Long Term Prospects Assets & Activities Technip in Africa Engineering & project management 1,000 people centers 1st office founded in 1995 Spoolbase: Dande, Angola Strong national content Umbilical…
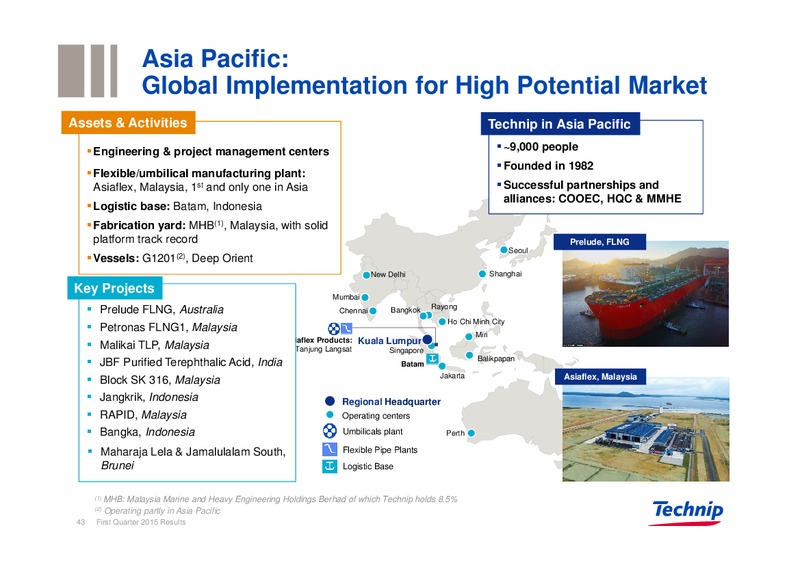
Asia Pacific: Global Implementation for High Potential Market Assets & Activities Technip in Asia Pacific Engineering & project management centers 9,000 people Founded in 1982 Flexible/umbilical manufacturing plant: Asiaflex,…
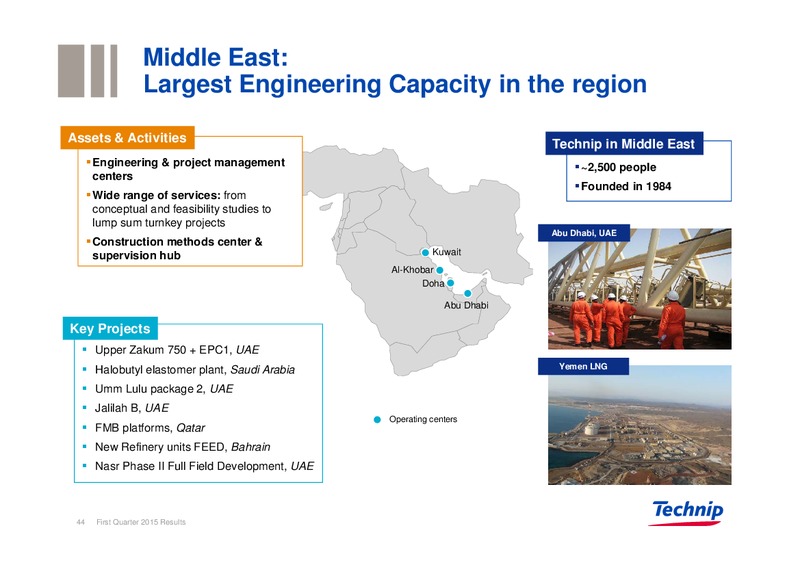
Middle East: Largest Engineering Capacity in the region Assets & Activities Technip in Middle East Engineering & project management 2,500 people centers Founded in 1984 Wide range of services: from conceptual and feasibility…
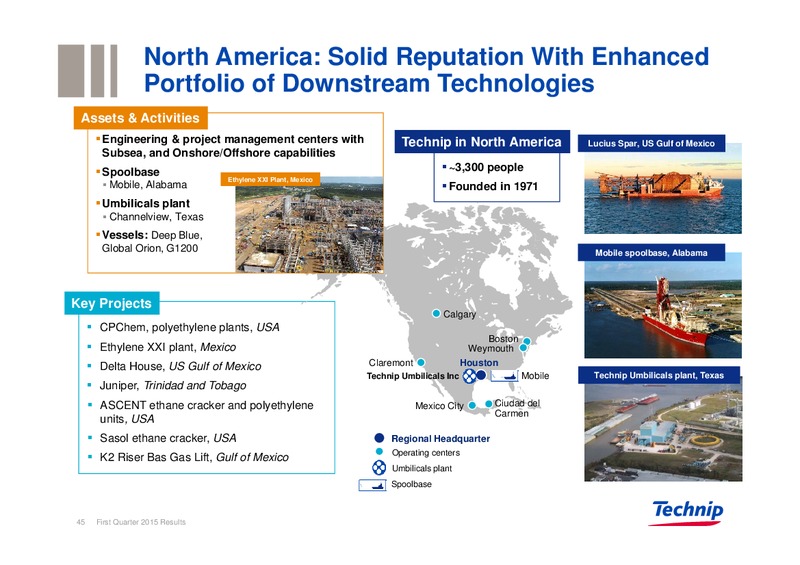
North America: Solid Reputation With Enhanced Portfolio of Downstream Technologies Assets & Activities Engineering & project management centers with Technip in North America Lucius Spar, US Gulf of Mexico Subsea, and Onshore/Offshore…
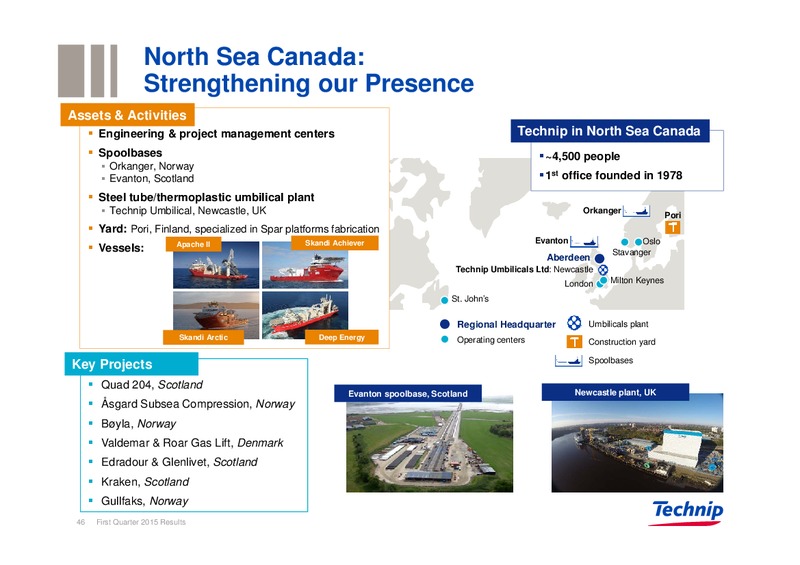
North Sea Canada: Strengthening our Presence Assets & Activities Engineering & project management centers Technip in North Sea Canada Spoolbases 4,500 people Orkanger, Norway Evanton, Scotland 1st office founded in 1978 Steel…
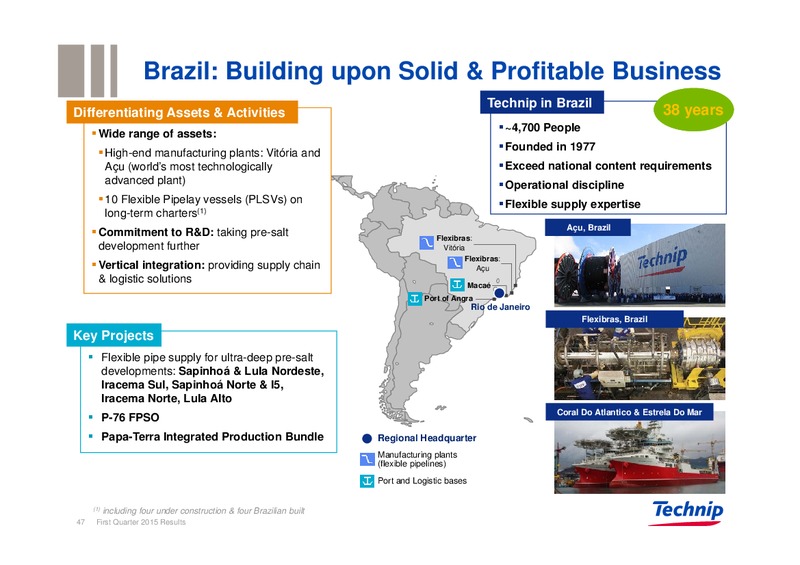
Brazil: Building upon Solid & Profitable Business Technip in Brazil Differentiating Assets & Activities 38 years 4,700 People Wide range of assets: Founded in 1977 High-end manufacturing plants: Vitria and Au (worlds most…
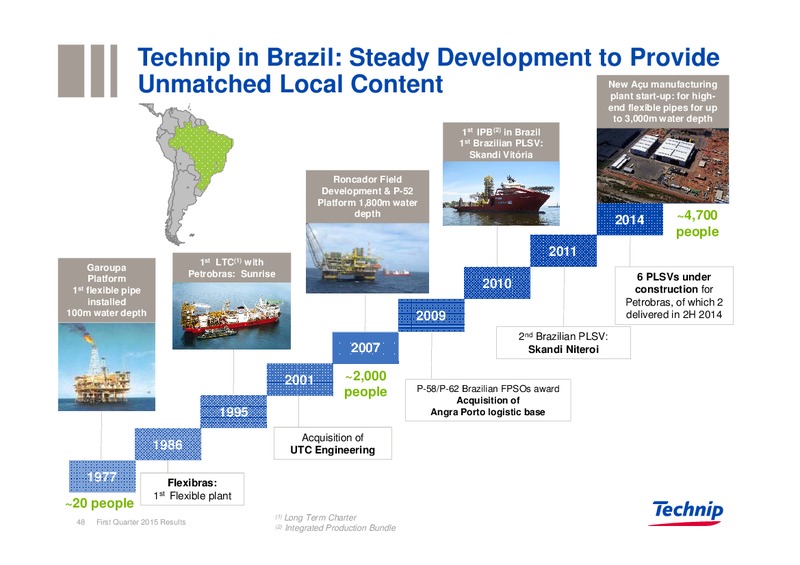
Technip in Brazil: Steady Development to Provide Unmatched Local Content New Au manufacturing plant start-up: for high- end flexible pipes for up to 3,000m water depth 1st IPB(2) in Brazil 1st Brazilian PLSV: Skandi Vitria…
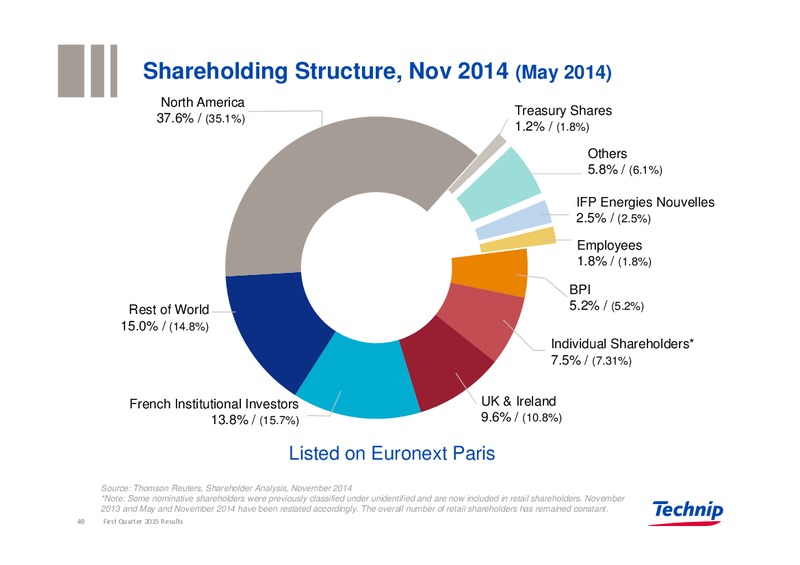
Shareholding Structure, Nov 2014 (May 2014) North America Treasury Shares 37.6% / (35.1%) 1.2% / (1.8%) Others 5.8% / (6.1%) IFP Energies Nouvelles 2.5% / (2.5%) Employees 1.8% / (1.8%) BPI Rest of World 5.2% / (5.2%)…
 Loading...