Fourth Quarter and Full Year 2014 Results Paris, February 18, 2015
Safe Harbor T his presentation contains both historical and forward-looking statements. These forward-looking statements are not based on historical facts, but rather reflect our current expectations concerning future results and…
Contents 2014 Full Year Review 2014 Operational & Financial Highlights Changing Market Environment: Shaping Technips Business Engaging with Clients 3 4Q & FY 2014 Results
2014 Full Year Review 4 4Q & FY 2014 Results
Technips Financial Performance in 2014 Objectives Financial Performance Adjusted revenue between 4.35 and 4.75 billion Adjusted revenue at 4.9 billion Subsea Subsea Adjusted operating margin at least 12% Adjusted operating margin at…
Technips Operational Performance in 2014 Key focus areas Operational Performance Subsea US Gulf of Mexico, Panyu, Greater Delivering our projects Western Flank Onshore/ Offshore Jubail, Heidelberg, PMP Delivering our projects…
Proposed Dividend Increase of 8% Dividend per share () CAGR: +9% 2.00(1) 1.85 1.68 1.58 1.45 1.35 1.20 2008 2009 2010 2011 2012 2013 2014 Technip is committed to a progressive dividend policy Shareholders offered an…
Fourth Quarter Subsea Highlights million Overall group vessel utilization rate Adjusted Revenue 74% in 4Q14 versus 69% a year ago 80% for the full year 2014 1,290 963 963 Offshore campaigns Block 15/06, Angola + 34% Quad 204,…
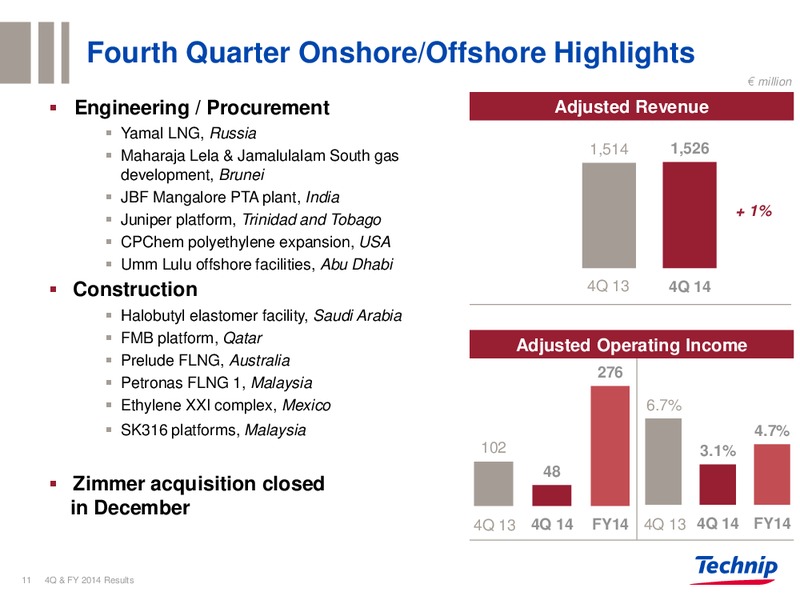
Fourth Quarter Onshore/Offshore Highlights million Engineering / Procurement Adjusted Revenue Yamal LNG, Russia Maharaja Lela & Jamalulalam South gas 1,514 1,514 1,526 development, Brunei JBF Mangalore PTA plant, India + 1%…
Foreign Exchange Management 2014 Revenues by Currency(1) Most projects are multi- EUR 17% currency and naturally 32% hedged USD & USD pegs 26% BRL, GBP, NOK BRL/GBP/NOK All currency flows are hedged at contract signature or as…
Fourth Quarter & FY 2014: Group Financial Highlights million Y-o-Y Y-o-Y 4Q 14 Change FY 14 Change Full year main elements: Adjusted Revenue 2,816 14% 10,725 16% Subsea adjusted revenue grew 20% Adjusted EBITDA(1) 319 21% 1,108…
Full Year Underlying Net Income of 564 million(1) Non-current items Group Net Income (in million) Sale of TPS engineering services for 9 buildings and infrastructure Other 68 Divestment of India diving business 16 MHB (75%…
Fourth Quarter 2014 & FY 2014: Cash Flow million million 3 Months 12 months September December 2014 2014 Net Income / (Loss) (including 83 442 Non-Controlling Interests) Adjusted Net Adjusted Net Adjusted Depreciation & 96…
Capex Discipline and Cost Control Capex Costs Continued focus on manufacturing and logistics SG&A* fell by 69 million in 2014 Decision on second replacement diving vessel on o 6.0% of revenue in 2014 vs. 7.7% of revenue in 2013…
Technip showed Strong Order Intake in the Fourth Quarter million Onshore / Offshore Order intake Ethane cracker and derivatives complex, EP&Cm, 1,957 Louisiana, USA 1 586 1,586 Oil and gas terminal for Vashishta & S1 fields,…
Worldwide Presence across Multiple Markets Addressing all Clients Diversified by Geography Diversified Divrsfied By Market Backlog Split 19% Deepwater 23% Deepwater Americas 29% Americas 1,000 meters* 1,000 meters* 29% Asia…
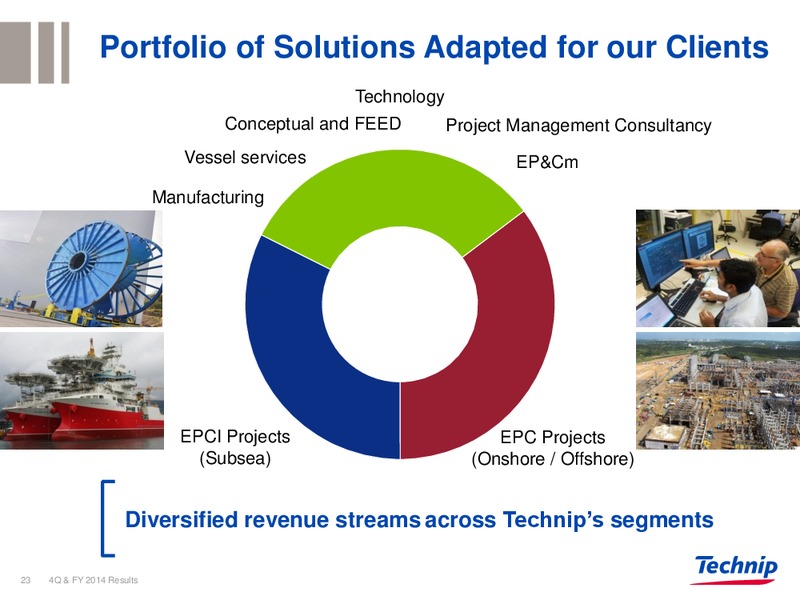
Portfolio of Solutions Adapted for our Clients Technology Conceptual and FEED Project Management Consultancy Vessel services EP&Cm Manufacturing EPCI Projects EPC Projects (Subsea) (Onshore / Offshore) Diversified revenue…
Optimize Cost- and Schedule-Driven Projects Conceptual studies FEED EPC(I) / Services Design cost-effective project execution plans by engaging early: Genesis and Technip Stone & Webster Process Technologies Offer Integrated…
Cost-Effective Solutions to Answer Clients Challenges Upstream Client goals Downstream Conceptual studies and FEEDs Conceptual studies and FEEDs Optimize designs Field architecture Technology licensing Smart solutions for…
2015 Objectives Aligned with Previous Guidance Subsea Adjusted revenue between 5.2 and 5.5 billion Adjusted operating income from recurring activities(1) between 810 and 840 million A much stronger 1Q than a year ago Onshore /…
Starting 2015 in a Strong Position Technology A record backlog of projects to deliver Key differentiating assets Actions in place to reduce our costs Execution capability Capex discipline reinforced Vertical integration Engaging…
Annex
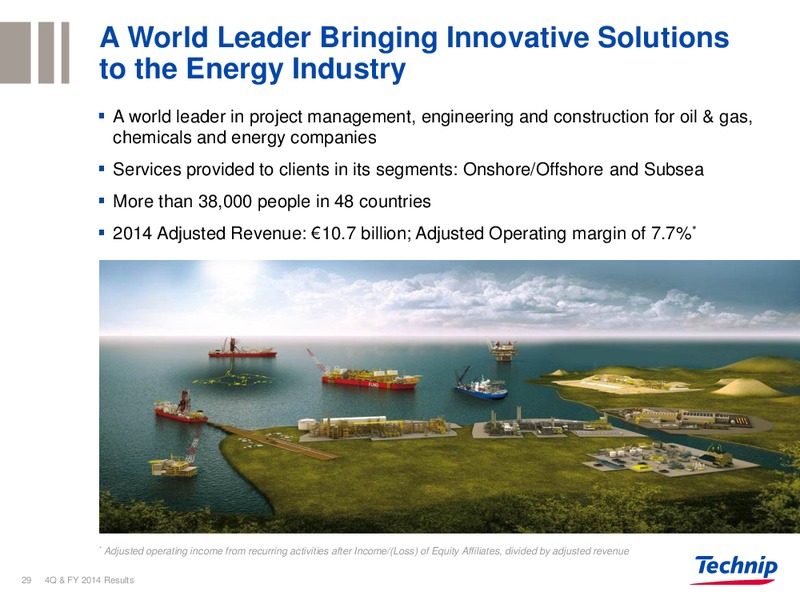
A World Leader Bringing Innovative Solutions to the Energy Industry A world leader in project management, engineering and construction for oil & gas, chemicals and energy companies Services provided to clients in its segments:…
Global Business with Unique Worldwide Footprint Evanton Technip Umbilicals(1) Ltd: Newcastle Orkanger Pori Oslo Aberdeen Stanvanger St. Petersburg Calgary Milton Keynes Zoetermeer St. Johns London Warsaw Dsseldorf Boston…
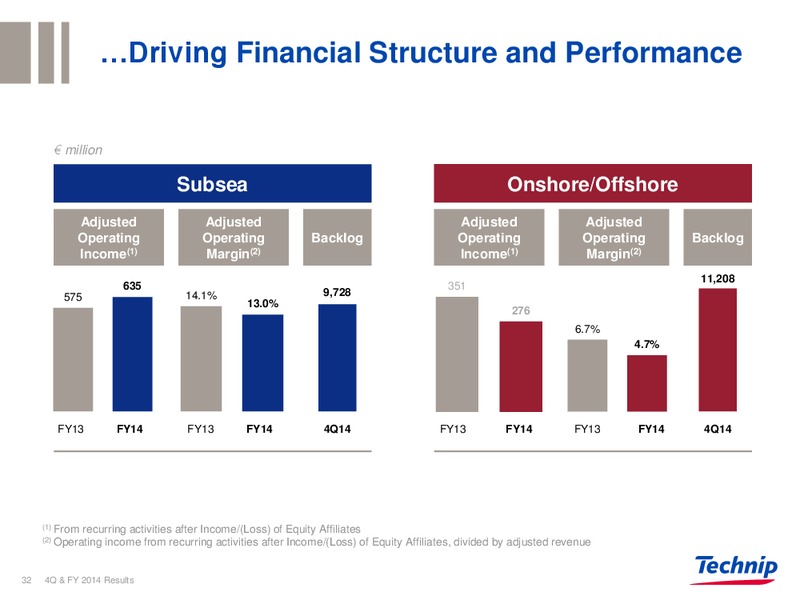
Complementary Business Segments Subsea Onshore Offshore 2014: 2014: Adjusted Revenue: 4,880 million Adjusted Revenue: 5,844 million Adjusted Operating Income: 635 million Adjusted Operating Income: 276 million Unique vertical…
Pursue a Balance of Contract Sizes(1) Subsea Onshore & Offshore 9.7 billion backlog 11.2 billion backlog Kaombo, our largest project, added over Yamal LNG, our largest project, added 1.5 billion over 4 billion Next largest…
Adjusted Consolidated Statement of Financial Position million December 31, December 31, 2013(1) 2014 Fixed Assets 5,976.9 6,414.2 Construction Contracts Amounts in Assets 405.0 756.3 Other Assets 3,436.2 3,691.2 Cash & Cash…
Subsea Vertical Integration: Customer Support from Concept to Execution Concept Execution Upstream Project Engineering & Procurement Engineering P with Genesis(1) R Manufacturing O Pre-FEED(2) and FEED J Flexible risers and…
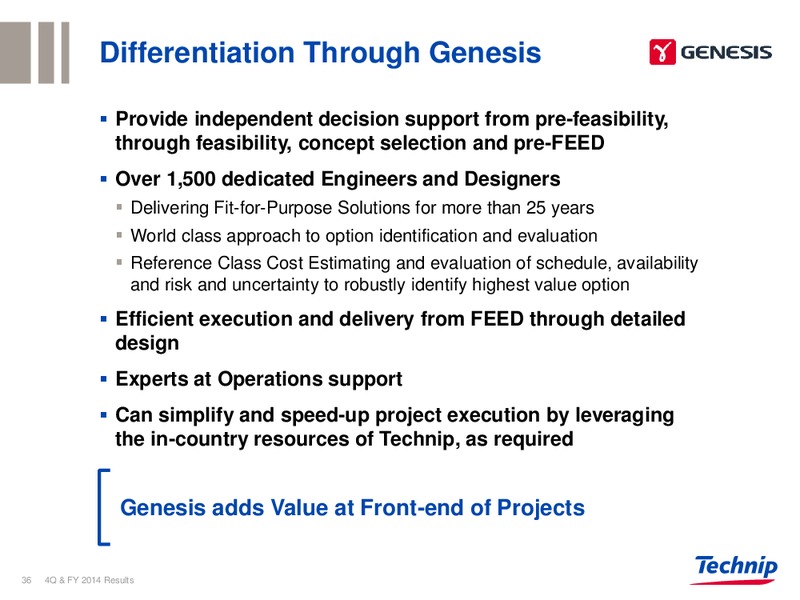
Differentiation Through Genesis Provide independent decision support from pre-feasibility, through feasibility, concept selection and pre-FEED Over 1,500 dedicated Engineers and Designers Delivering Fit-for-Purpose Solutions for…
Innovation & Technology Center (ITC) Boost innovation to provide our clients with solutions for increasing complex & harsh subsea Innovation & Technology Center (1) in developments Rueil-Malmaison, France Demonstrate Technips…
Worlds Only Integrated Subsea Solution Provider Genesis(1): Providing independent subsea architecture development and component selection Technip: Integrating our subsea proprietary technologies and offshore platform know-how with…
Very Broad Execution Capabilities in Subsea Heavy Lift J-Lay & S-Lay Reel-Lay J-Lay & Subsea Reel-Lay Heavy Lift Ultra-deep water infield lines Deepwater infield lines Deep-to-shore (Very high tensions: alliance with…
High Visibility in Brazil through Strong PLSV Demand Tonnage Vitria 250t Four new PLSVs with DOF 250t Niteri 5-year option 550t Coral Do Atlantico (5-year charter) 5-year option pre-salt Estrela Do Mar (5-year charter)…
High Performing Fleet(1) Per Type of Vessel (2) Deep Constructor Deep Orient Deep Pioneer Wellservicer Flexible Lay Sunrise 2000 Orelia Diving Multi & North Sea Atlantic Support Skandi Achiever Construction Vessel North Sea…
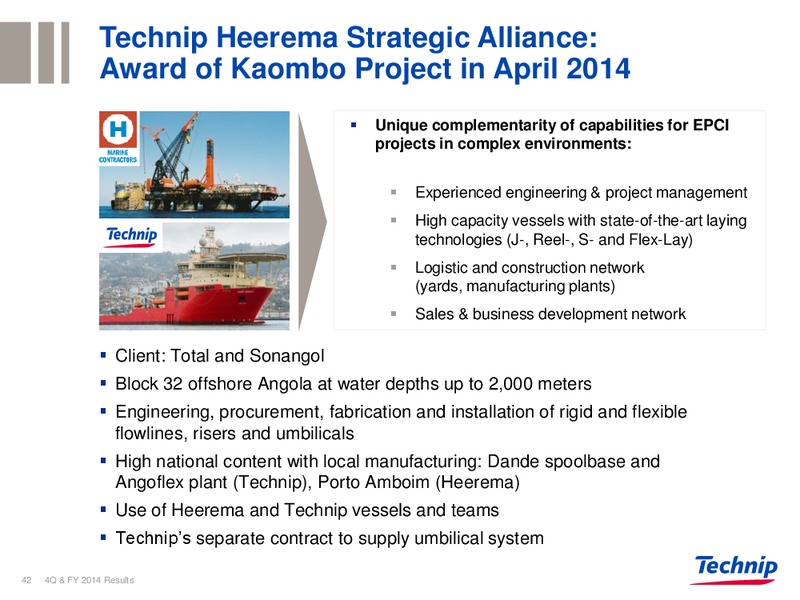
Technip Heerema Strategic Alliance: Award of Kaombo Project in April 2014 Unique complementarity of capabilities for EPCI projects in complex environments: Experienced engineering & project management High capacity vessels with…
World Leader in Gas Monetization, Refining and Petrochemicals Gas Monetization Gas treatment Fengzhen LNG Plant, EP, China LNG Trunkline LNG, FEED, USA (Liquefied Natural Gas) Yamal LNG, EPC, Russia GTL (Gas to Liquids)…
Technip has a Portfolio of Market Leading Onshore Technologies Product Line Technologies Gas Monetization Cryogenic Separation, Gas Liquefaction, Gas Processing Proprietary technologies Hydrogen Steam Methane Reforming, Syngas, and…
Technip Stone & Webster Process Technology Diversifies Revenue Streams Offering three types of services Licenses Process Design / Engineering Proprietary Equipment Licensed proprietary Process design packages / Design, supply…
U.S. Shale Gas Opportunities Downstream Monetization Technips Leading Positions NGLs Ethylene Plants Grassroots Upstream Midstream Revamps Extraction Separation Derivative Units Propylene Drilling Polymers Gas Treatment / NGL…
Yamal LNG: High Revenue and Capacity Utilization Visibility through 2019 Project overview Client: Yamal LNG (Novatek, Total, CNPC) Technip leader of partnership (50%) with JGC & Chiyoda 3 trains of 5.5 mtpa capacity each to be…
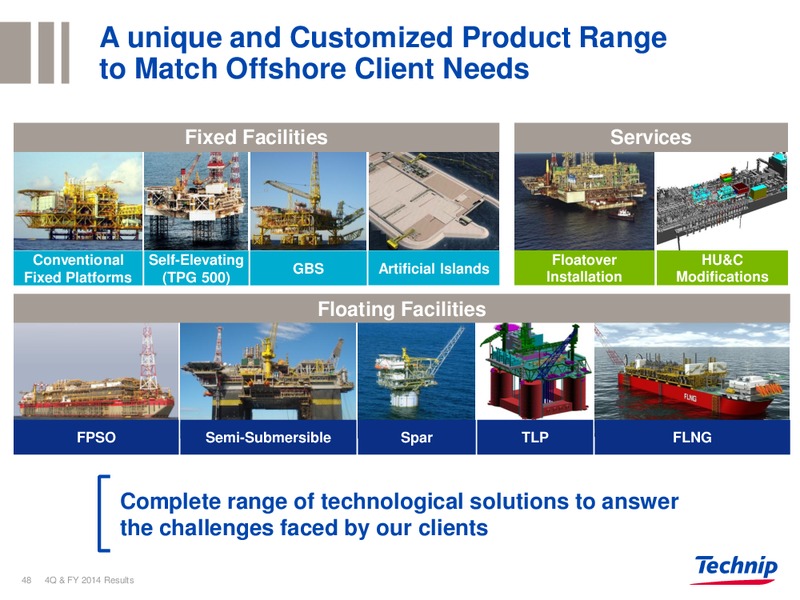
A unique and Customized Product Range to Match Offshore Client Needs Fixed Facilities Services Conventional Self-Elevating Floatover HU&C GBS Artificial Islands Fixed Platforms (TPG 500) Installation Modifications Floating…
FLNG Leader with First Mover Advantage Shell FLNG Petronas FLNG 1 LNG capacity: 3.6 mtpa LNG capacity: 1.2 mtpa Field: Prelude, Western Australia Field: Offshore Malaysia Project Status: Project Status: Construction ongoing in…
Technip: Attractive Long Term Partner* Air Products Heerema 20-year milestone of the longest and most Alliance through combination of unique productive global hydrogen alliance assets and engineering resources to help supporting the…
Africa: Expanding Footprint and Long Term Prospects Assets & Activities Technip in Africa Engineering & project management 1,000 people centers 1st office founded in 1995 Spoolbase: Dande, Angola Strong national content Umbilical…
Asia Pacific: Global Implementation for High Potential Market Assets & Activities Technip in Asia Pacific Engineering & project management centers 9,000 people Founded in 1982 Flexible/umbilical manufacturing plant: Asiaflex,…
Middle East: Largest Engineering Capacity in the Region Assets & Activities Technip in Middle East Engineering & project management 2,500 people centers Founded in 1984 Wide range of services: from conceptual and feasibility…
North America: Solid Reputation With Enhanced Portfolio of Downstream Technologies Assets & Activities Engineering & project management centers with Technip in North America Lucius Spar, US Gulf of Mexico Subsea, and Onshore/Offshore…
North Sea Canada: Strengthening our Presence Assets & Activities Engineering & project management centers Technip in North Sea Canada Spoolbases 4,500 people Orkanger, Norway Evanton, Scotland 1st office founded in 1978 Steel…
Brazil: Building upon Solid & Profitable Business Technip in Brazil Differentiating Assets & Activities 38 years 4,700 People Wide range of assets: Founded in 1977 High-end manufacturing plants: Vitria and Au (worlds most…
Technip in Brazil: Steady Development to Provide Unmatched Local Content New manufacturing plant: Au 6 PLSVs on long-term charters for up to 3,000m water depth 1st IPB(2) in Brazil 1st Brazilian PLSV: Skandi Vitria Roncador…
 Loading...