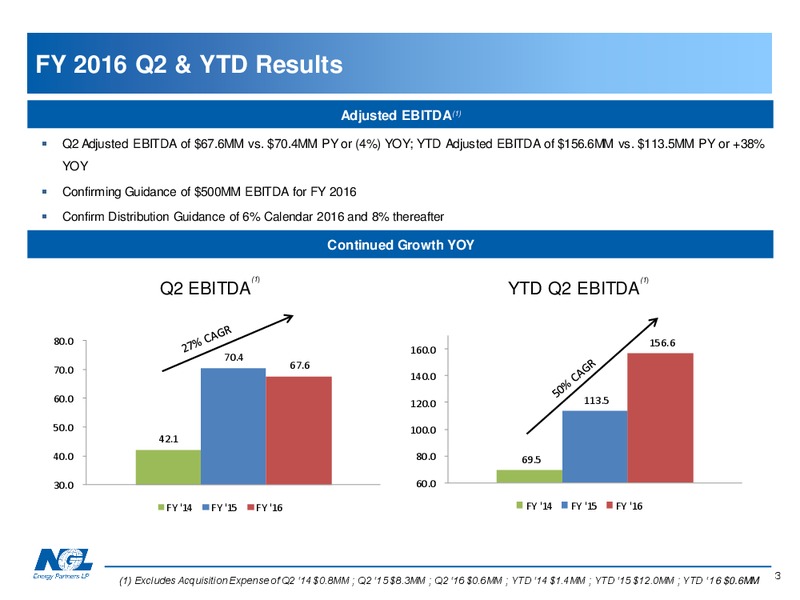
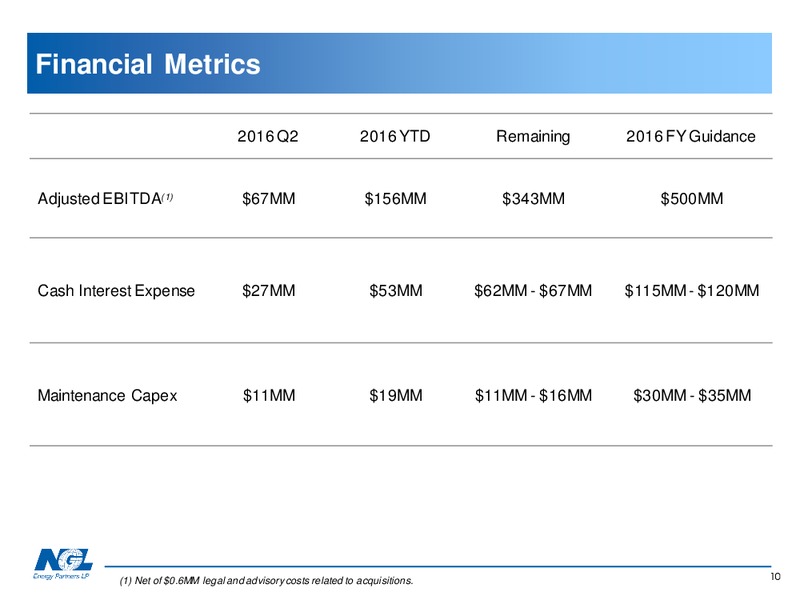
FY 2016 Q2 & YTD Results Adjusted EBITDA(1) Q2 Adjusted EBITDA of 67.6MM vs. 70.4MM PY or (4%) YOY; YTD Adjusted EBITDA of 156.6MM vs. 113.5MM PY or +38% YOY Confirming Guidance of 500MM EBITDA for FY 2016 Confirm Distribution…
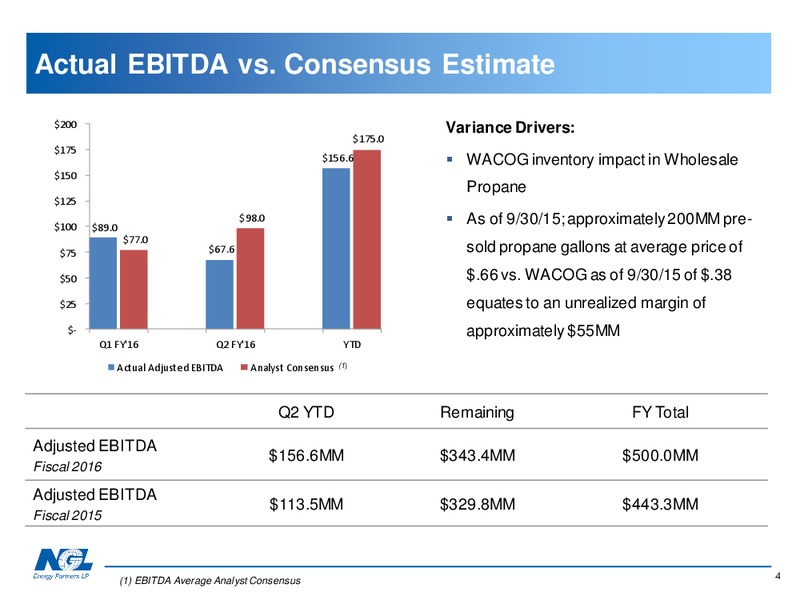
Actual EBITDA vs. Consensus Estimate 200 Variance Drivers: 175.0 175 156.6 WACOG inventory impact in Wholesale 150 Propane 125 100 89.0 98.0 As of 9/30/15; approximately 200MM pre- 77.0 75 67.6 sold propane gallons at average…
Macro-Economic Back-drop Theme Current FY 2015 Impact Crude Price 45 90 Margin compression in Crude Marketing, Decreased value of crude cut in Water Solutions segment Increased value from Contango in Crude Storage Refined 190,000…
Adjusted EBITDA by Segment (s in Thousands) Refined 2nd QTR Crude Oil Water Retail Products/ Corporate Logistics Solutions Liquids Propane Renewables and Other Total Three Months Ended September 30, 2015 Adjusted EBITDA 13,773…
Commodity Price/Volume Sensitivity Segment Impact Crude Logistics Crude Marketing targets a Margin of 1.5% of the Crude Oil Price 1 change in crude price impacts margins .015 per bbl .10 change in Contango impacts EBITDA by 6MM…
Liquidity Update (in millions, unaudited) 9/30/2015 Commited Liquidity (1) Cash and Cash Equivalents 27.6 Revolver Availability (includes accordion exercise) 325.0 Total Liquidity 352.6 Debt Senior Secured Notes 250.0…
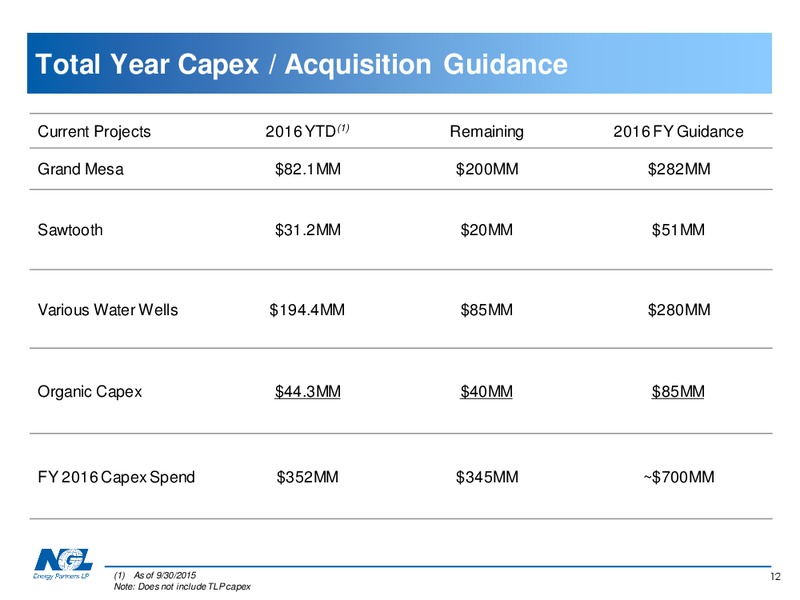
Total Year Capex / Acquisition Guidance Current Projects 2016 YTD(1) Remaining 2016 FY Guidance Grand Mesa 82.1MM 200MM 282MM Sawtooth 31.2MM 20MM 51MM Various Water Wells 194.4MM 85MM 280MM Organic Capex 44.3MM 40MM 85MM…
Section II Appendix 13
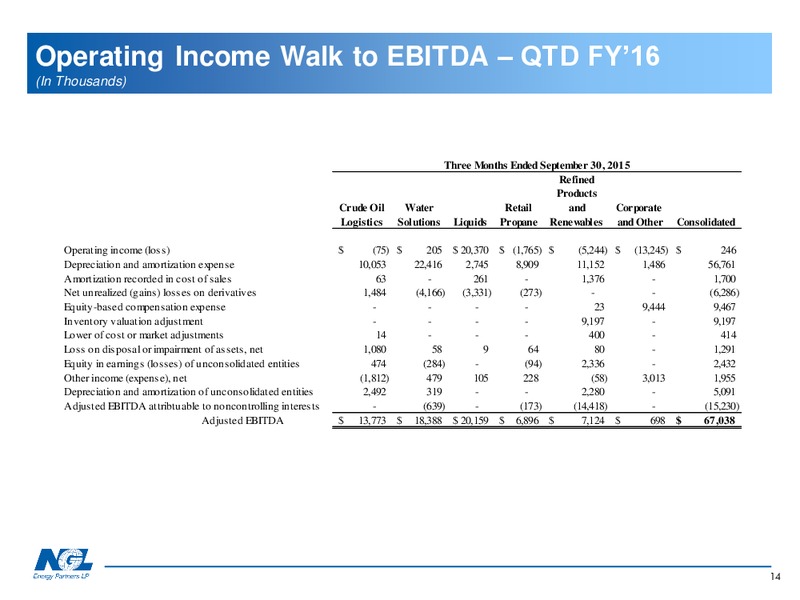
Operating Section II Income Walk to EBITDA QTD FY16 (In Thousands) Three Months Ended September 30, 2015 Refined Products Crude Oil Water Retail and Corporate Logistics Solutions Liquids Propane Renewables and Other…
Operating Section II Income Walk to EBITDA QTD FY15 (In Thousands) Three Months Ended September 30, 2014 Refined Products Crude Oil Water Retail and Corporate Logistics Solutions Liquids Propane Renewables and Other…
Operating Section Operating II Income Walk Income Walk to to EBITDA EBITDA YTD YTD FY16 FY16 (In Thousands) Six Months Ended September 30, 2015 Refined Products Crude Oil Water Retail and Corporate Logistics Solutions…
Operating Section Operating II Income Walk Income Walk to to EBITDA EBITDA YTD YTD FY15 FY15 (In Thousands) Six Months Ended September 30, 2014 Refined Products Crude Oil Water Retail and Corporate Logistics Solutions…
Section II EBITDA Walk Adjusted Three Months Ended September 30, Six Months Ended September 30, 2015 2014 2015 2014 (in thousands) Net loss (24,152) (15,879) (62,678) (55,789) Net income attributable to noncontrolling interests…
 Loading...