DELIVERING IN CHALLENGING TIMES Maersk Oil Maersk Group Capital Markets Day, 9 September 2015
page 4 DELIVERING RESULTS Top quartile performance and profitable growth 306,000 boepd 300 mmboe USD 1.7 billion Production growth Reserves additions Capex and Opex reductions from sanctioned realised in response to major…
page 5 A year of progress Strong operational performance improvements First oil on time and on budget from Jack (US), Golden Eagle (UK) and Tyra SE (DK) Sanctioned Culzean (UK) and Johan Sverdrup (NO) Major cost savings…
page 7 The oil price, looking ahead The oil price will likely stay at current but we expect the oil price to go higher levels in the short term as the supply-demand gap normalises Million barrels per day Brent price (USD/barrel)…
page 8 Industry response Major project cancellations and deferrals Cost cutting and workforce reductions Impairments Renegotiation of contracts and project costs
page 9 ... and what it means to Maersk Oil How we are different Maersk Oil response Proactive strategy effort in 2014 prepared us On target to reach 10% opex reduction end of for a lower oil price 2015 with a goal of 20% by end of…
page 13 FINANCIAL AMBITION Adjusting to the new environment Continued focus on 10% ROIC Capital expenditure A maturing cost management; over the cycle within investment resource base USD 1.7 billion Capex range of USD 2-4 and Opex…
page 15 Entitlement production growth continues 2015 guidance increased from 265,000 boepd to 285,000 boepd Maersk Oil entitlement production Peer production growth (000 bpd) (Percentage change Q2-2014 to Q2-2015) 400 30% 350 25%…
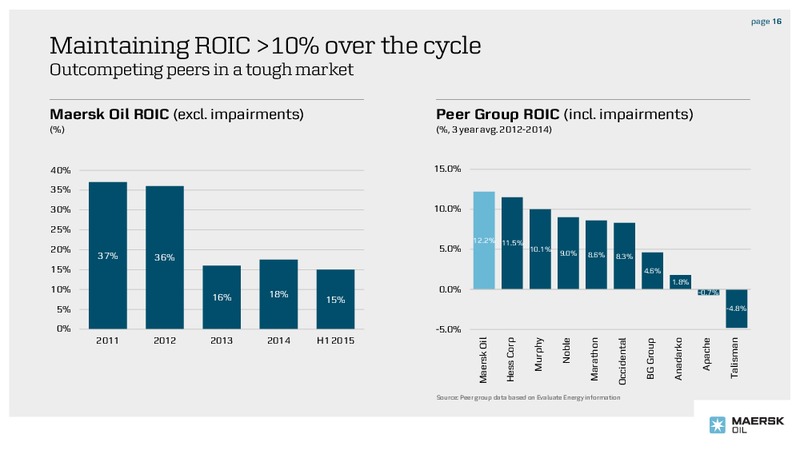
page 16 Maintaining ROIC 10% over the cycle Outcompeting peers in a tough market Maersk Oil ROIC (excl. impairments) Peer Group ROIC (incl. impairments) (%) (%, 3 year avg. 2012-2014) 40% 15.0% 35% 30% 10.0% 25% 12.2% 11.5% 20%…
page 17 Capital discipline Investing through the cycle Development Capex1) Reducing development Capex towards (USD million) USD 2-4 billion/year, not including inorganic growth 4,000 3,500 Significant Capex reductions realised in…
page 18 Check workforce % ok Reducing our costs Portfolio Management Organisational and Process Efficiency Focus on cost leadership and building a sustainable cost base On track to reach 10% Opex savings end of 2015 and 20%…
page 21 Reliable and predictable operations performance SHORT-TERM DELIVERY MEDIUM-TERM GROWTH Operations Excellence Project Delivery 66% 30% 33% 3 2 22% fewer safety production growth reduction of major projects major…
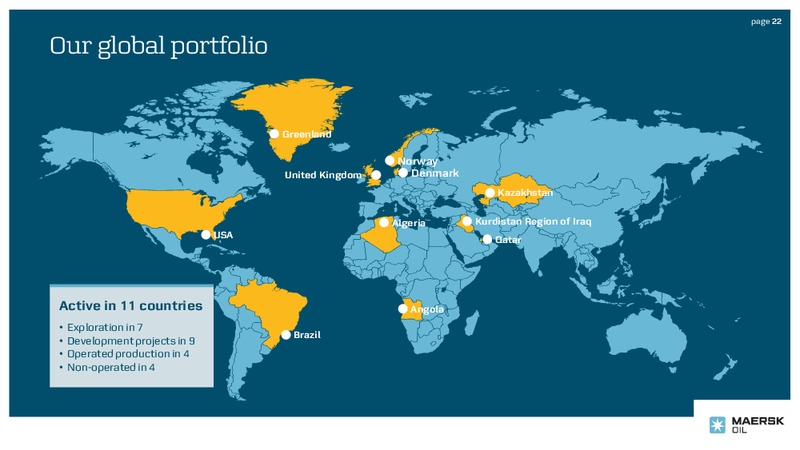
page 22 Our global portfolio Greenland Norway United Kingdom Denmark Kazakhstan Algeria Kurdistan Region of Iraq USA Qatar Active in 11 countries Angola Exploration in 7 Brazil Development projects in 9 Operated…
page 23 A safer Maersk Oil Maersk Oil safety performance Process Safety Lost Time Injury Frequency (LTIF) per million working hours Comprehensive programme to manage process safety 2.5 -66% 2.0 1.5 1.0 2.2 1.2 0.5 0.9 0.9…
page 24 Production growth continues Maersk Oil entitlement production Entitlement production continues to build (000 bpd) Operations Excellence is reducing 340 unplanned downtime and increasing 320 production +30% 300 More planned…
page 25 Operations Excellence in mature fields Adding low cost barrels Example: GP3 in UK Central North Sea Production Production 10% Operations Excellence Operations Excellence 85% Infill wells production increase Infill…
page 26 Taking action to reduce operating costs Contract renegotiation Development in Opex per barrel USD/bbl 25 Prioritising high value work -33% 20 Standardisation and 15 23 simplification 10 21 20 19 17 16 16 16 16 17…
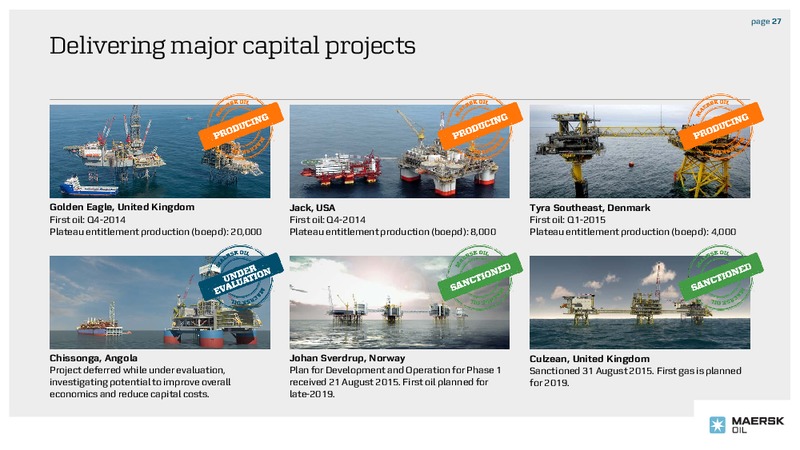
page 27 Delivering major capital projects Golden Eagle, United Kingdom Jack, USA Tyra Southeast, Denmark First oil: Q4-2014 First oil: Q4-2014 First oil: Q1-2015 Plateau entitlement production (boepd): 20,000 Plateau entitlement…
page 28 Reliable and predictable operations performance SHORT-TERM DELIVERY MEDIUM-TERM GROWTH Operations Excellence Project Delivery 66% 30% 33% 3 2 22% fewer safety production growth reduction of major projects major…
page 30 OUR RESPONSE OPTIMISING OPERATIONS NAVIGATING TO THE FINANCIAL EXCELLENCE AND TURBULENT MARKET CHANGES PERFORMANCE PROJECT DELIVERY WATERS Continued focus on cost Sound financial results in a 66% fewer safety incidents…
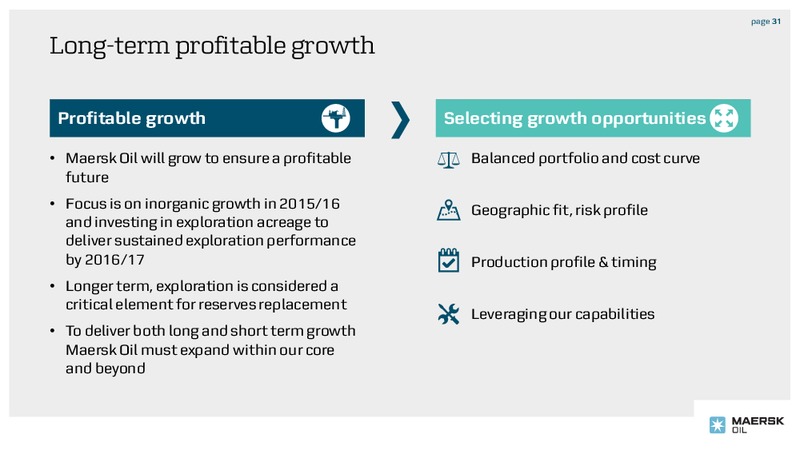
page 31 Long-term profitable growth Profitable growth Selecting growth opportunities Maersk Oil will grow to ensure a profitable Balanced portfolio and cost curve future Focus is on inorganic growth in 2015/16 Geographic fit,…
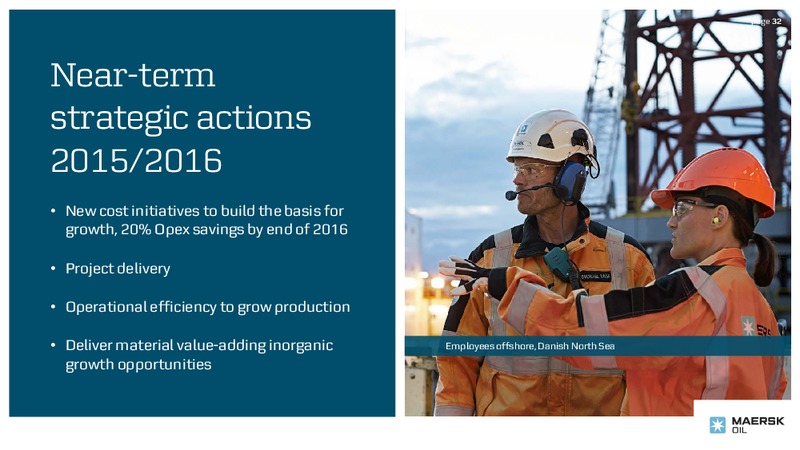
page 32 Near-term strategic actions 2015/2016 New cost initiatives to build the basis for growth, 20% Opex savings by end of 2016 Project delivery Operational efficiency to grow production Deliver material value-adding…
page 33 DELIVERING RESULTS Top quartile performance and profitable growth 306,000 boepd 300 mmboe USD 1.7 billion Production growth Reserves additions Capex and Opex reductions from sanctioned realised in response to major…
 Loading...