Resetting costs capturing opportunities London, 4 February 2016 Classification: Internal 2012-10-24 Eldar Stre, President and CEO
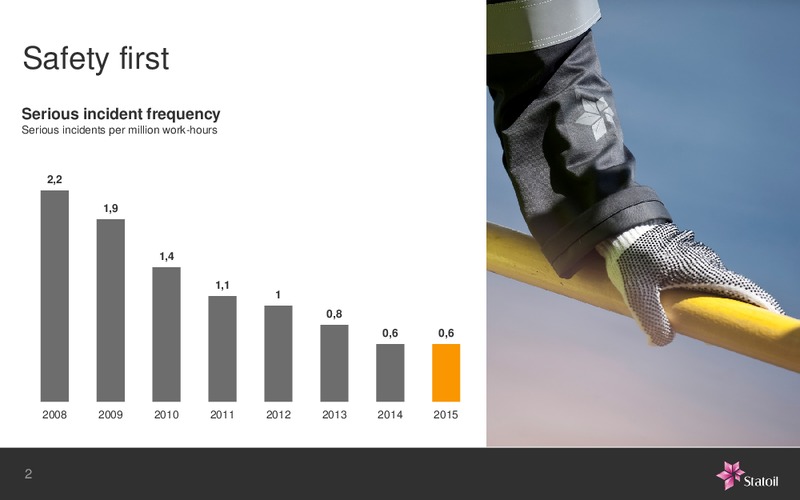
Safety first Serious incident frequency Serious incidents per million work-hours 2,2 1,9 1,4 1,1 1 0,8 0,6 0,6 2008 2009 2010 2011 2012 2013 2014 2015 2
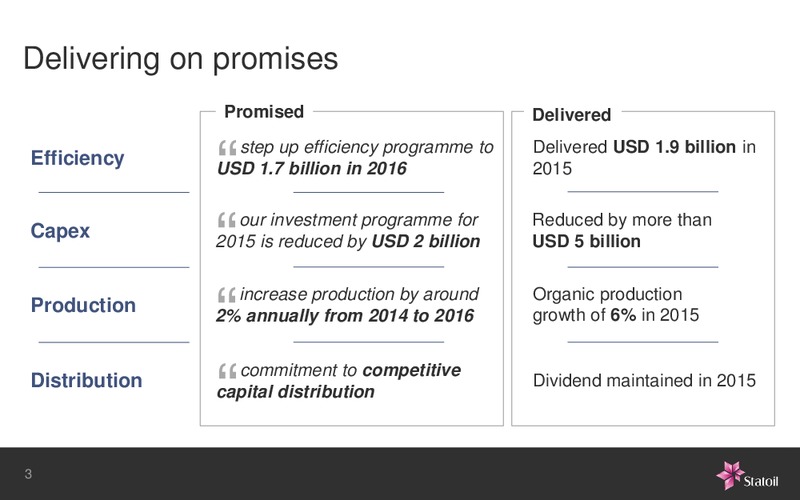
Delivering on promises Promised Delivered step up efficiency programme to Delivered USD 1.9 billion in Efficiency USD 1.7 billion in 2016 2015 our investment programme for Reduced by more than Capex 2015 is reduced by USD 2…
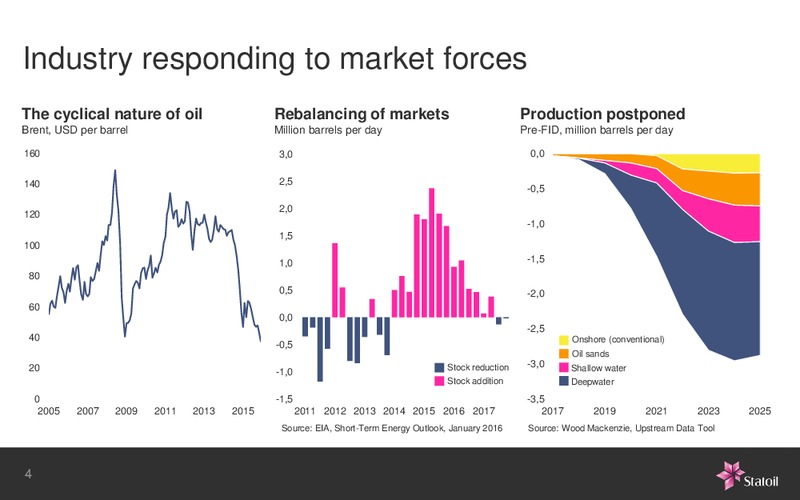
Industry responding to market forces The cyclical nature of oil Rebalancing of markets Production postponed Brent, USD per barrel Million barrels per day Pre-FID, million barrels per day 160 3,0 0,0 140 2,5 -0,5 2,0 120 -1,0 1,5…
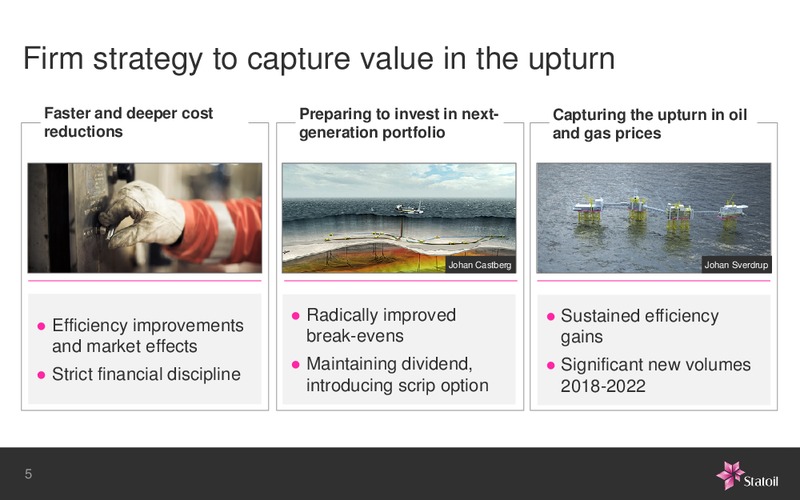
Firm strategy to capture value in the upturn Faster and deeper cost Preparing to invest in next- Capturing the upturn in oil reductions generation portfolio and gas prices Johan Castberg Johan Sverdrup Radically improved…
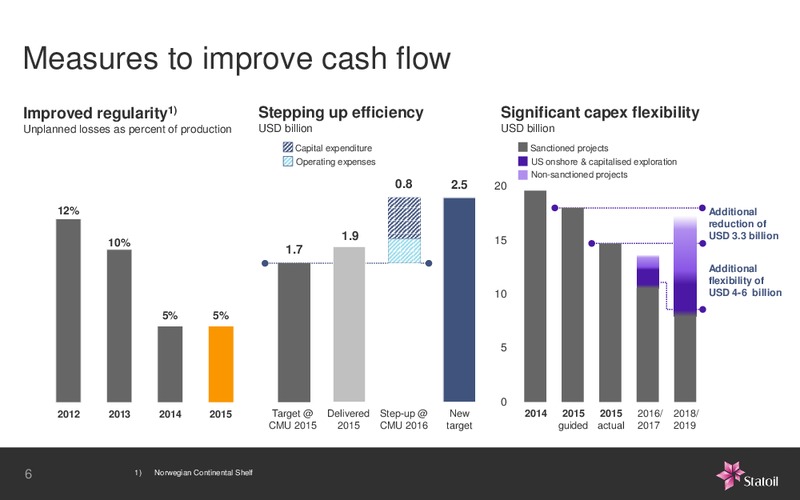
Measures to improve cash flow Improved regularity1) Stepping up efficiency Significant capex flexibility Unplanned losses as percent of production USD billion USD billion Capital expenditure Sanctioned projects Operating expenses US…
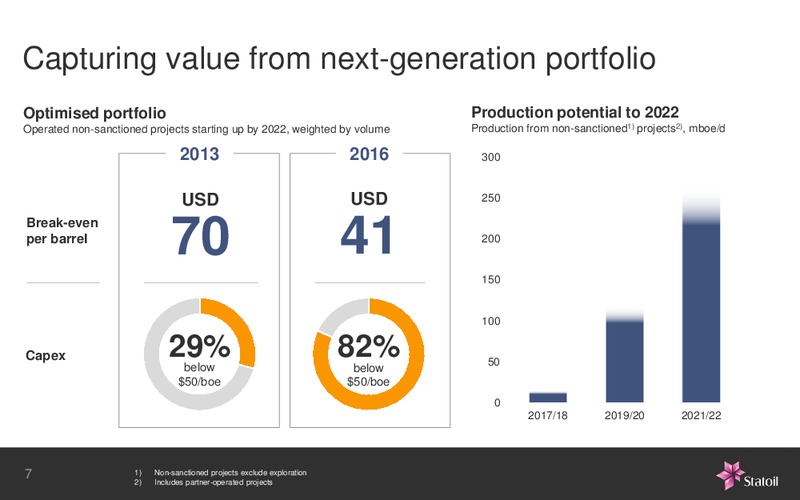
Capturing value from next-generation portfolio Optimised portfolio Production potential to 2022 Operated non-sanctioned projects starting up by 2022, weighted by volume Production from non-sanctioned1) projects2), mboe/d 2013 2016…
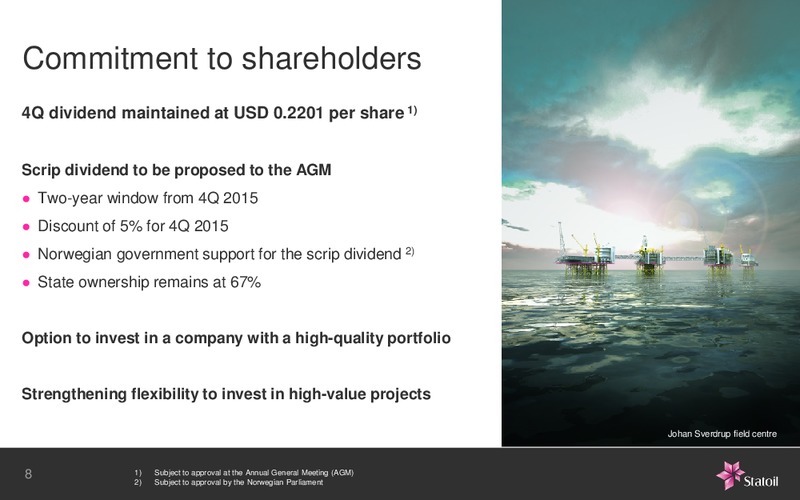
Commitment to shareholders 4Q dividend maintained at USD 0.2201 per share 1) Scrip dividend to be proposed to the AGM Two-year window from 4Q 2015 Discount of 5% for 4Q 2015 Norwegian government support for the scrip dividend 2)…
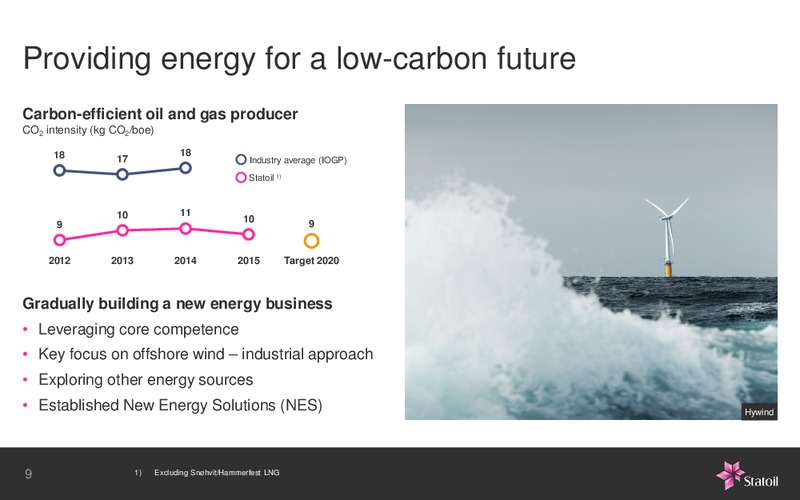
Providing energy for a low-carbon future Carbon-efficient oil and gas producer CO2 intensity (kg CO2/boe) 18 18 17 Industry average (IOGP) Statoil 1) 10 11 10 9 9 2012 2013 2014 2015 Target 2020 Gradually building a new…
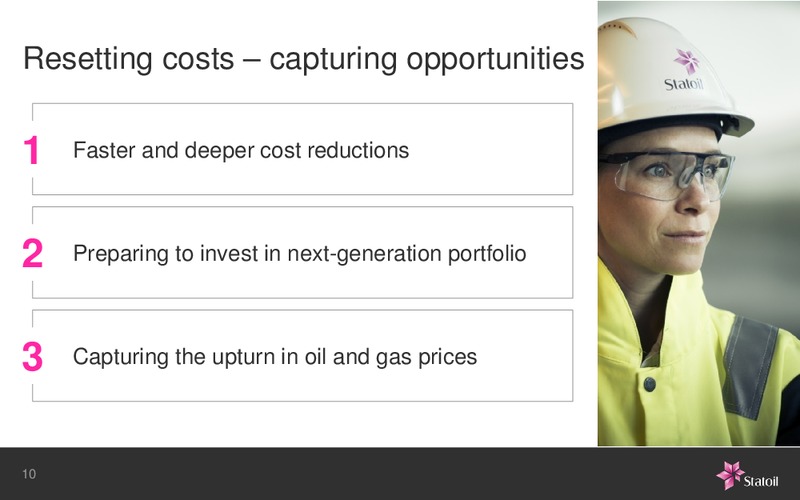
Resetting costs capturing opportunities 1 Faster and deeper cost reductions 2 Preparing to invest in next-generation portfolio 3 Capturing the upturn in oil and gas prices 10
11
4th Quarter and Full Year 2015 London, 4 February 2016 Classification: Internal 2012-10-24 Hans Jakob Hegge, Executive Vice President and CFO
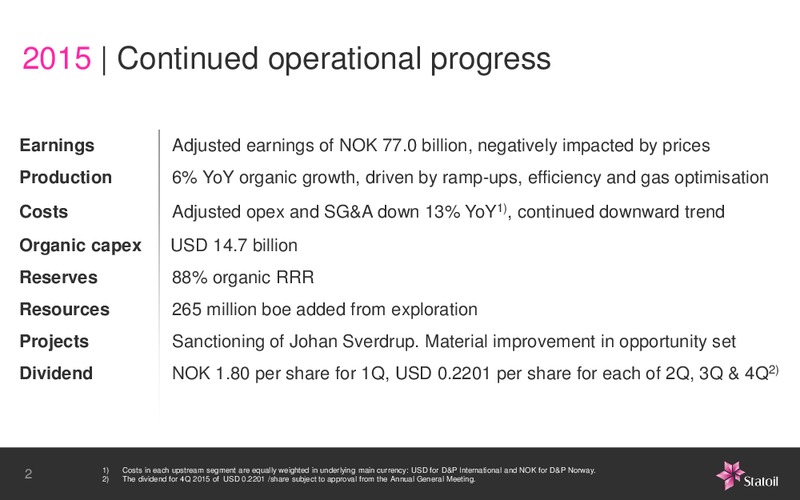
2015 Continued operational progress Earnings Adjusted earnings of NOK 77.0 billion, negatively impacted by prices Production 6% YoY organic growth, driven by ramp-ups, efficiency and gas optimisation Costs Adjusted opex and SG&A down 13%…
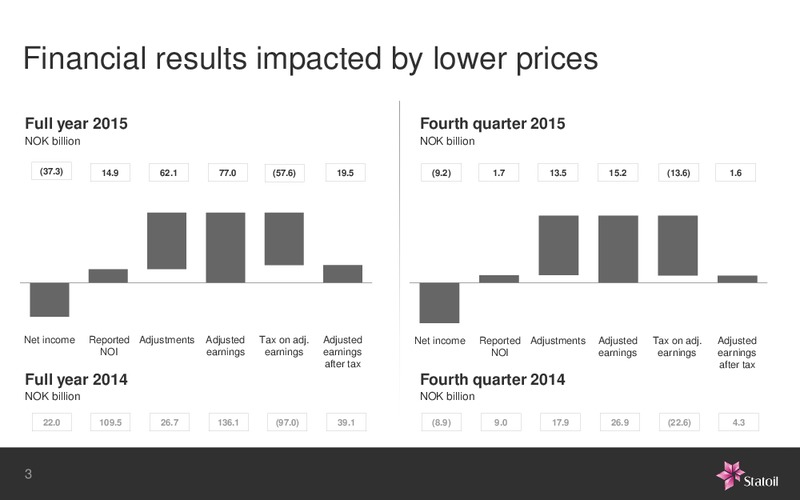
Financial results impacted by lower prices Full year 2015 Fourth quarter 2015 NOK billion NOK billion (37.3) 14.9 62.1 77.0 (57.6) 19.5 (9.2) 1.7 13.5 15.2 (13.6) 1.6 Net income Reported Adjustments Adjusted Tax on adj. Adjusted Net…
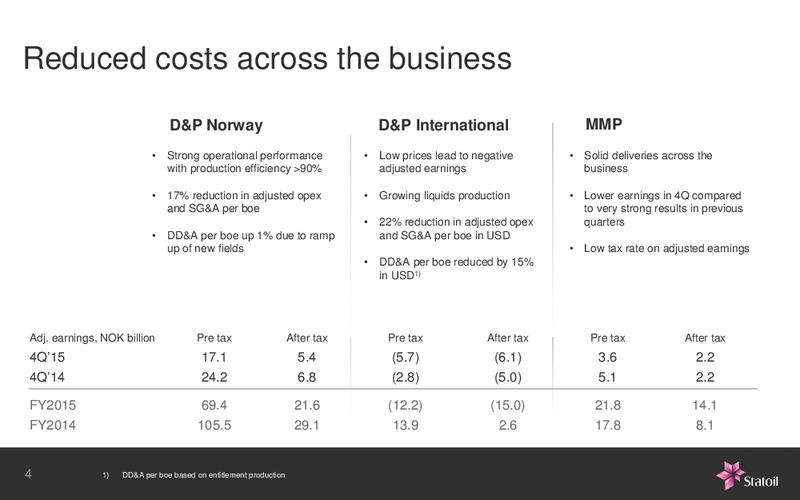
Reduced costs across the business D&P Norway D&P International MMP Strong operational performance Low prices lead to negative Solid deliveries across the with production efficiency 90% adjusted earnings business 17% reduction in…
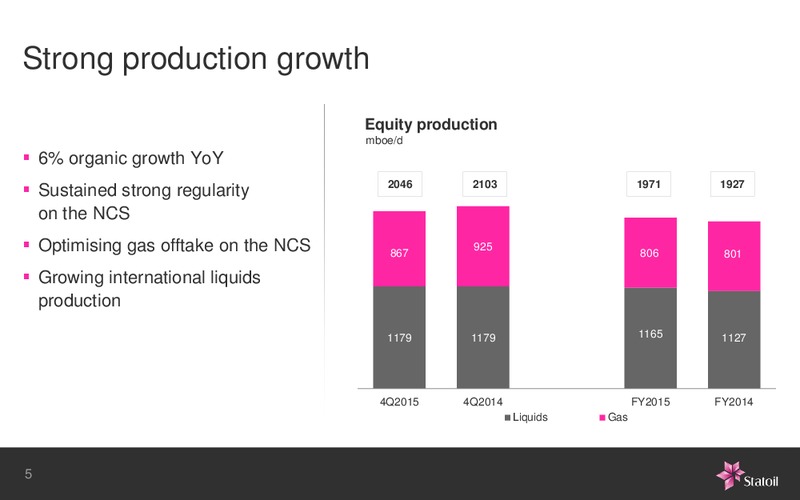
Strong production growth Equity production mboe/d 6% organic growth YoY Sustained strong regularity 2046 2103 1971 1927 on the NCS Optimising gas offtake on the NCS 867 925 806 801 Growing international liquids production…
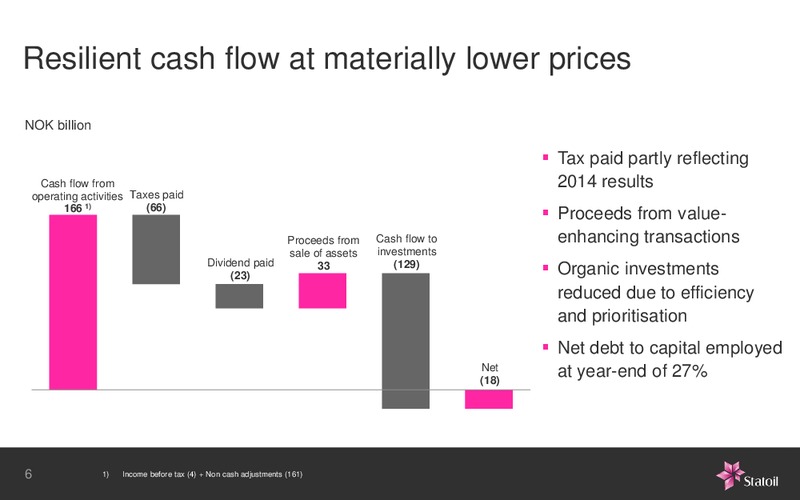
Resilient cash flow at materially lower prices NOK billion Tax paid partly reflecting Cash flow from 2014 results operating activities Taxes paid (66) 166 1) Proceeds from value- Proceeds from Cash flow to enhancing transactions…
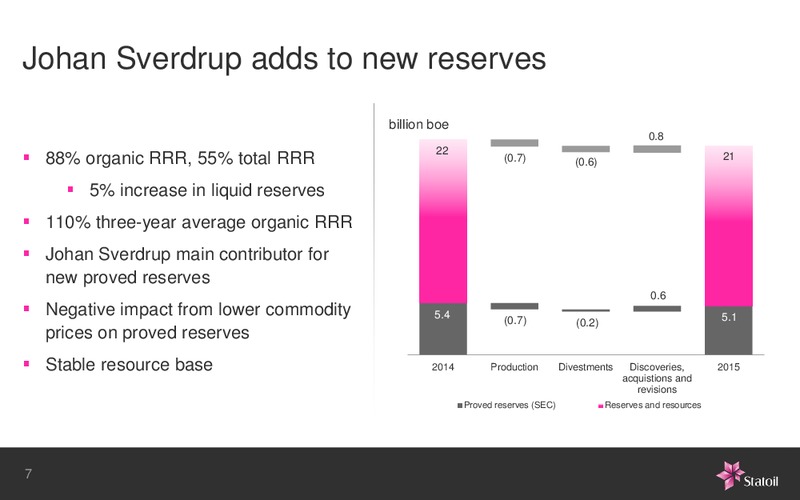
Johan Sverdrup adds to new reserves billion boe 0.8 22 88% organic RRR, 55% total RRR (0.7) (0.6) 21 5% increase in liquid reserves 110% three-year average organic RRR Johan Sverdrup main contributor for new proved reserves…
Resetting costs - capturing opportunities London, 4 February 2016 Classification: Internal 2012-10-24 Hans Jakob Hegge, Executive Vice President and CFO
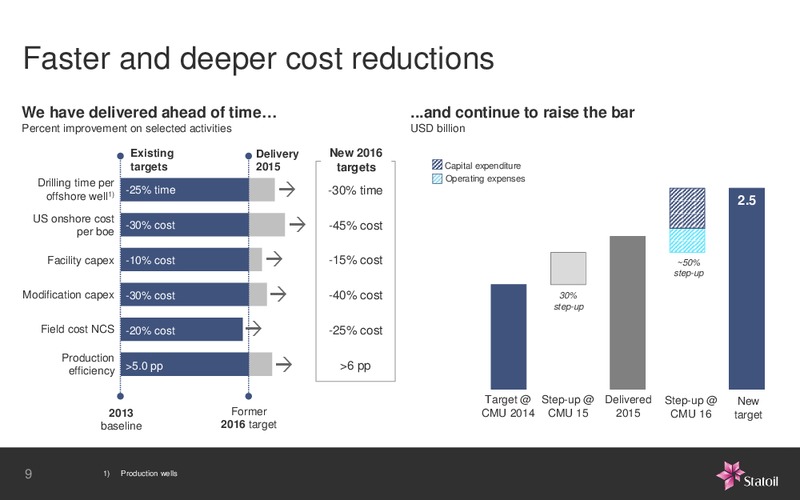
Faster and deeper cost reductions We have delivered ahead of time ...and continue to raise the bar Percent improvement on selected activities USD billion Existing Delivery New 2016 targets 2015 targets Capital expenditure Drilling…
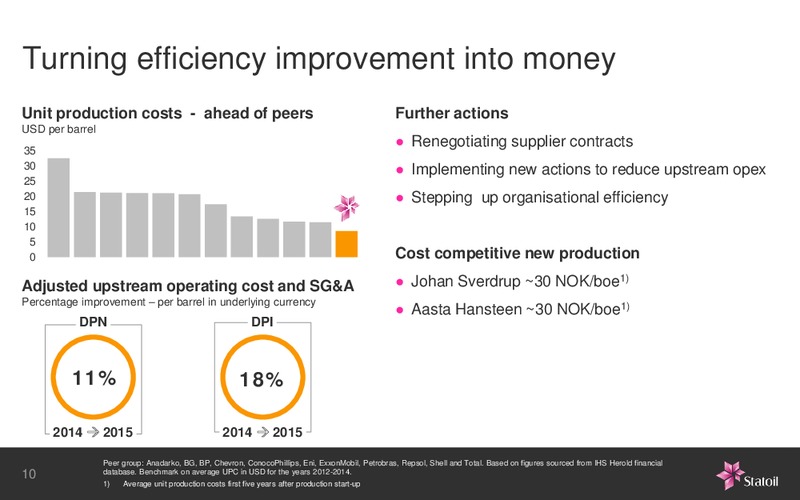
Turning efficiency improvement into money Unit production costs - ahead of peers Further actions USD per barrel Renegotiating supplier contracts 35 30 Implementing new actions to reduce upstream opex 25 20 Stepping up organisational…
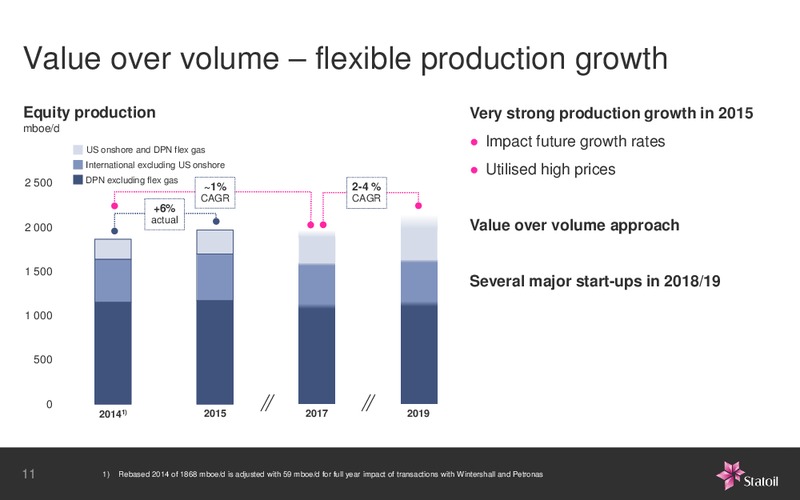
Value over volume flexible production growth Equity production Very strong production growth in 2015 mboe/d US onshore and DPN flex gas Impact future growth rates International excluding US onshore Utilised high prices 2 500 DPN…
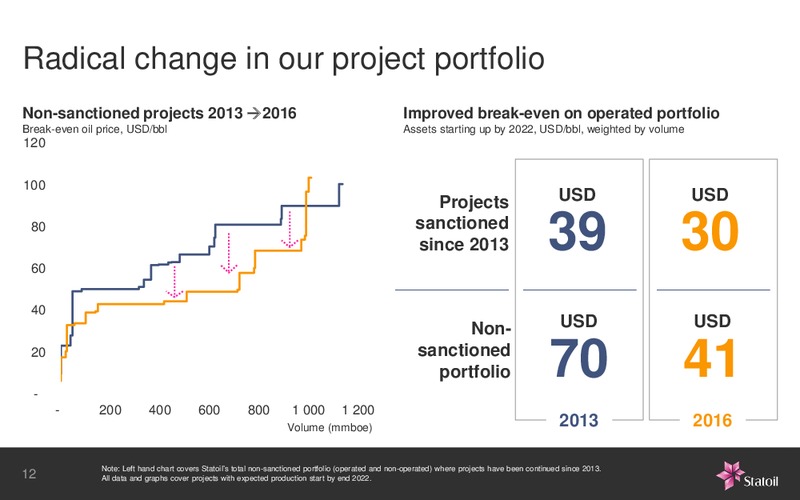
Radical change in our project portfolio Non-sanctioned projects 2013 2016 Improved break-even on operated portfolio Break-even oil price, USD/bbl Assets starting up by 2022, USD/bbl, weighted by volume 120 100 Projects USD USD 80…
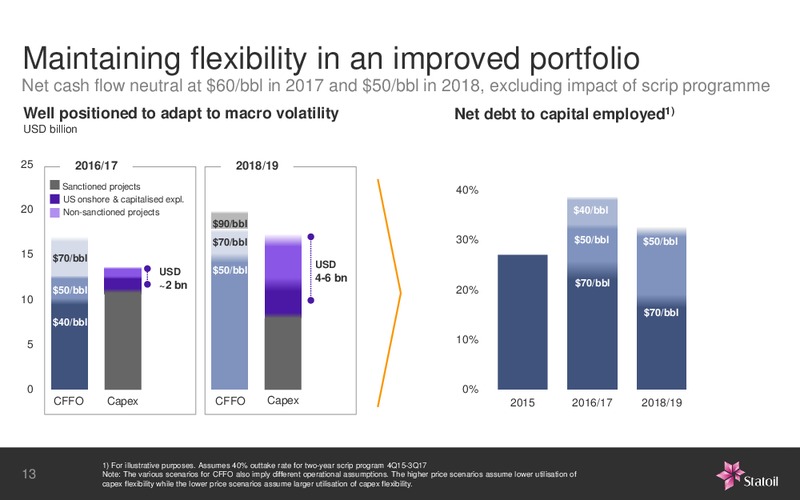
Maintaining flexibility in an improved portfolio Net cash flow neutral at 60/bbl in 2017 and 50/bbl in 2018, excluding impact of scrip programme Well positioned to adapt to macro volatility Net debt to capital employed1) USD billion 25…
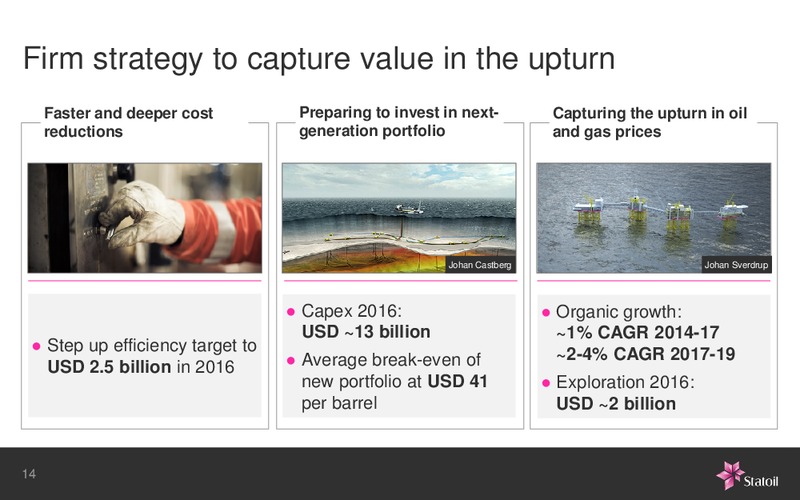
Firm strategy to capture value in the upturn Faster and deeper cost Preparing to invest in next- Capturing the upturn in oil reductions generation portfolio and gas prices Johan Castberg Johan Sverdrup Capex 2016: Organic…
15
Investor Relations in Statoil Main Desk: +47 22 97 20 42 E-mail: irpoststatoil.com Investor Relations Europe Peter Hutton Senior Vice President phuttstatoil.com +44 788 191 8792 Lars Valdresbrten IR Officer lavastatoil.com +47 40 28…
Supplementary Information Classification: Internal 2012-10-24
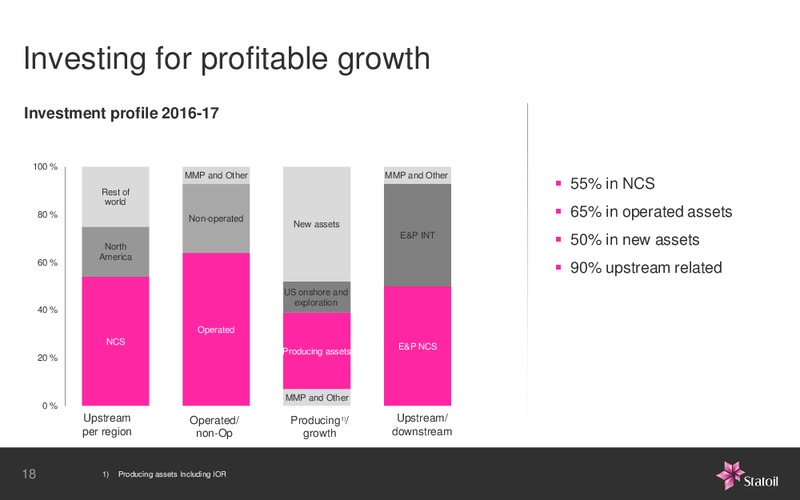
Investing for profitable growth Investment profile 2016-17 100 % MMP and Other MMP and Other Rest of 55% in NCS world 80 % Non-operated 65% in operated assets New assets North E&P INT 50% in new assets America 60 % 90%…
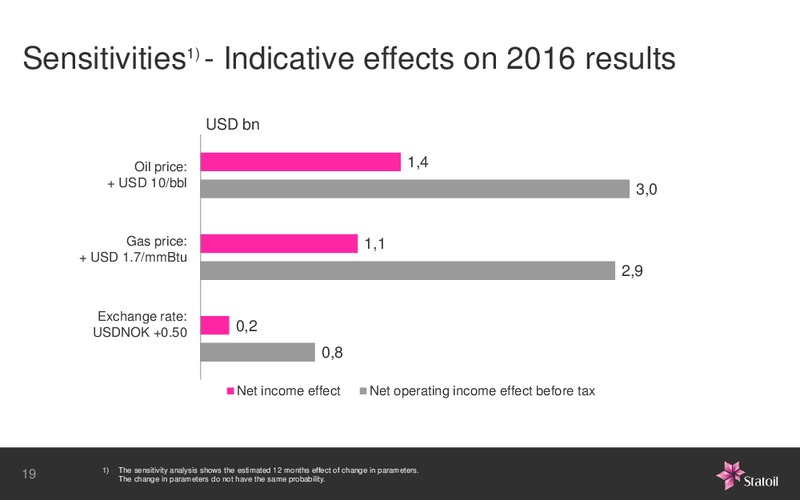
Sensitivities1) - Indicative effects on 2016 results USD bn Oil price: 1,4 + USD 10/bbl 3,0 Gas price: 1,1 + USD 1.7/mmBtu 2,9 Exchange rate: USDNOK +0.50 0,2 0,8 Net income effect Net operating income effect before…
 Loading...