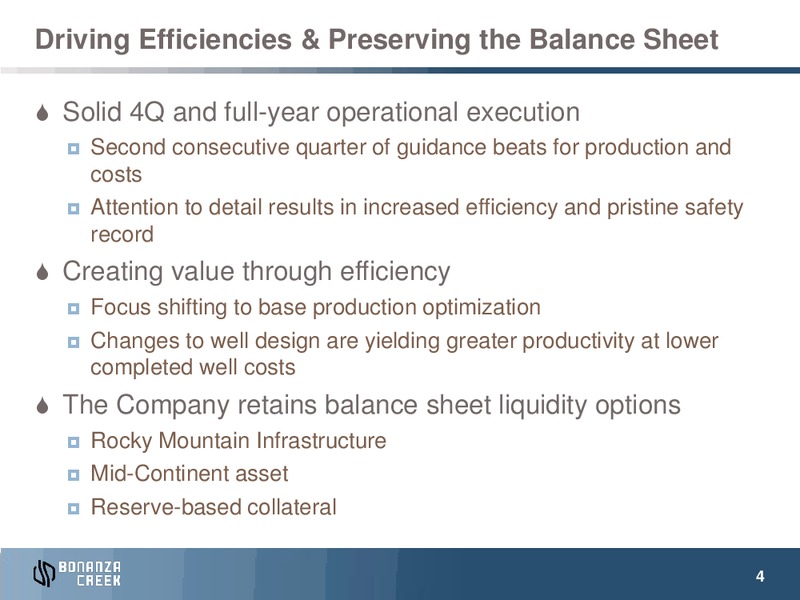
Driving Efficiencies & Preserving the Balance Sheet Solid 4Q and full-year operational execution Second consecutive quarter of guidance beats for production and costs Attention to detail results in increased efficiency and pristine…
4Q15 Highlights GAAP net loss of 573.7 million, or 12.08 per diluted share; Adjusted net loss of 8.4 million, or 0.17 per diluted share (1) Adjusted EBITDAX of 67.1 million for 4Q15.(1) Production CAPEX 30 200 164 Annual CAPEX:…
Base Production Optimization 2015 initiatives enhance 2015 Pronghorn Base Production Case Study Exceeds Plan base production 6,000 SCADA system automates field operations 5,000 Infrastructure expansion 4,000 eliminates down…
2015/2016 Well Design Enhancements Potential Well Cost Performance Design Enhancement Impact Effect Sand Loading Increase to 1,500lbs/lateral foot Additional sand creates more complex fracture + 150,000 + up to 25% network…
Increased Sand Continues to Outperform 24% uplift at day 480 22% uplift at day 300 Upsized Frac Job 1,500 lbs per lateral ft Standard Frac Job 1,000 lbs per lateral ft 10
Plug-and-Perf Completions Plug-and-perf ideal for mono- Potential 25% Uplift bore well design Expected cost similar to sliding sleeves on multi-well pads Provides 1,920 entry points into the reservoir vs. 40 with sliding…
Further Well Cost Reductions Cost reductions from 3Q15 resulted from eliminated field level infrastructure, well design enhancements, and service cost reductions. 2016 drilling program will focus on areas with existing infrastructure…
Financial Position 2016 strategic focus on maintaining liquidity during downturn Debt Maturities at December 31, 2015 405 million in liquidity(1) at 4Q15 600 Long-dated, low coupon unsecured debt 500 issuances 400 millions…
2016 Outlook Company plans to operate one rig in its Wattenberg asset and complete 12 gross wells in the first quarter Shift activity from D&C to base production optimization Focus on asset sales Re-market Rocky Mountain…
Investment Recap World- Class Asset Company Headquarters Base 410 17th Street, Suite 1400 Denver, Colorado 80202 (720) 440-6100 Optimizing Contiguous Base Acreage in Production rural area Investor Relations James R. Edwards…
Appendix 16
Adjusted Net Income (1) Reconciliation Three Months Ended December 31, 2015 Net Loss (573,663) Adjustments to net loss: Derivative gain (5,286) Derivative cash settlements 42,624 Impairment of proved properties 573,698…
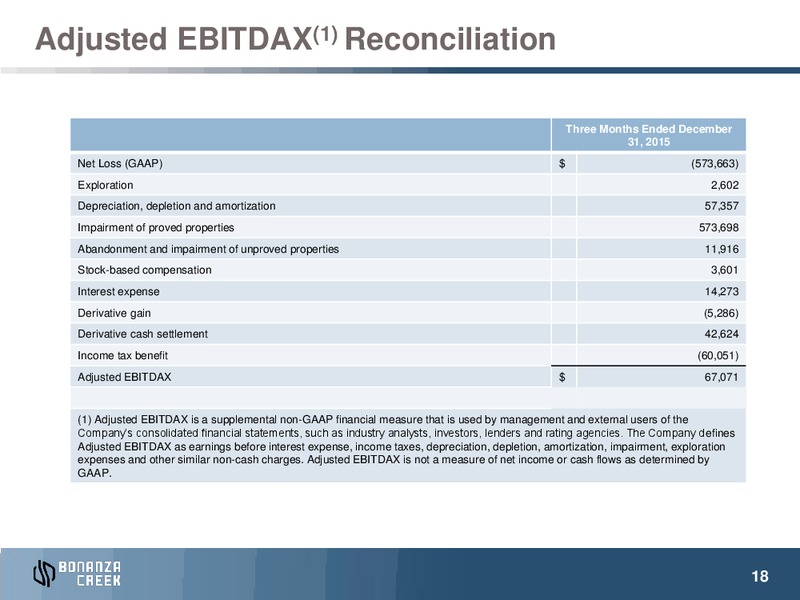
Adjusted EBITDAX(1) Reconciliation Three Months Ended December 31, 2015 Net Loss (GAAP) (573,663) Exploration 2,602 Depreciation, depletion and amortization 57,357 Impairment of proved properties 573,698 Abandonment and impairment…
Reconciliation to Cash Margin We define unhedged cash margin per Boe as oil and natural gas revenues, less (1) lease operating expense, (2) oil and natural gas taxes, and (3) cash G&A expense (excludes stock-based compensation), divided…
Stacked Pay in High-Margin Oil Window 70,000 net acres in delineated oil window Zero exposure to urban population eliminates regulatory setback risk Blocky acreage accommodates long laterals Established field level and regional…
Contiguous Position Enables Efficient Development Contiguous Leasehold Position Advantage on 97,000 Gross (70,000 Net) Acres Minimize rig movement time from pad to pad Leverage efficient batch drilling approach on multi-well pads…
Consistent Geology Throughout Acreage Position Niobrara A Bench 3 Thinner and resistivity less developed vs B & C Benches 22 Niobrara B Bench 1 4 Consistent thickness and resistivity across BCEI leasehold 5 Niobrara C Bench 6 7…
 Loading...