2015 delivering on our targets Strong production 57.6 kboepd, above guidance, driven by high operating efficiency and performance despite disposal of non-core assets 16/boe opex, down 100m from 2014 Reducing costs Gross G&A costs…
Proposed E.ON acquisition rationale and status Strengthens Premiers position in UK North Sea with its associated tax benefits; opportunity to generate operating and cost synergies Proforma 2015 Production Continues Premiers track…
UK Robin Allan North Sea and Exploration Director
Solan first oil shortly, moving on to second oil First oil All construction and subsea infrastructure fully commissioned Tanker trials complete and habitation achieved (25 persons on the platform) Winter weather has impacted final…
Catcher under budget and scheduled for 2017 2015 Highlights FPSO: First section delivered in December 1.6bn (gross budget 2015 subsea installation programme to first oil) successfully completed Under budget at 2015YE Fabrication of…
Catcher initial drilling results encouraging Ensco 100 rig on hire since July 3 wells drilled with excellent operational performance two injectors (CTI1 and CCI2) Well results one producer (CCP3) confirm high quality Pre-drill…
E.ON UK assets strong start to 2016 Elgin Franklin Area (5.2% non-op.) Tolmount (50%, op.) Current production 110 kboepd World class Resources 200 Bcf 1Tcf (gross) (gross) Significant asset with Peak production 150-200 mmcfd gas…
SE Asia & Falkland Islands Neil Hawkings SE Asia & Falkland Islands Director
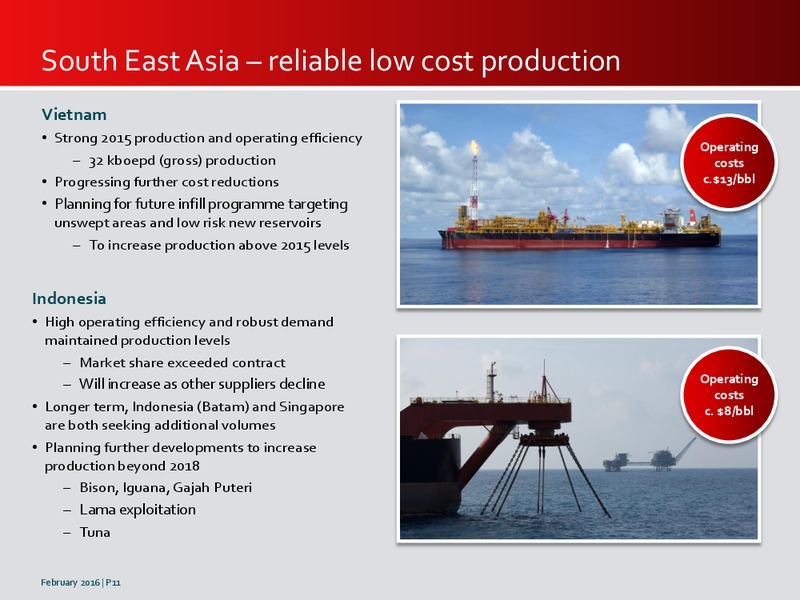
South East Asia reliable low cost production Vietnam Strong 2015 production and operating efficiency Operating 32 kboepd (gross) production costs Progressing further cost reductions c.13/bbl Planning f0r future infill programme…
North Falklands Basin potential confirmed Successful exploration programme now complete Zebedee discovery proves up additional resource to northern North Falklands Basin development Sea Lion complex Adds c. 60 mmbls resource to Sea…
Sea Lion low cost option for large future value Phase 1 project economics enhanced Collaborative partnership 220 mmbbl from NE & NW areas of PL032 Subsea FPSO 18 wells (13 pre-drilled) and 20 year field life Installation 1.8bn capex…
Finance Richard Rose Finance Director
Strong cash flows despite lower oil prices 12 months 12 months Capital expenditure (m) to 31 Dec to 31 Dec 2015 2016E 2015 2014 m m Exploration 216 c100 Working Interest production (kboepd) 57.6 63.6 Development 854 c600 Total…
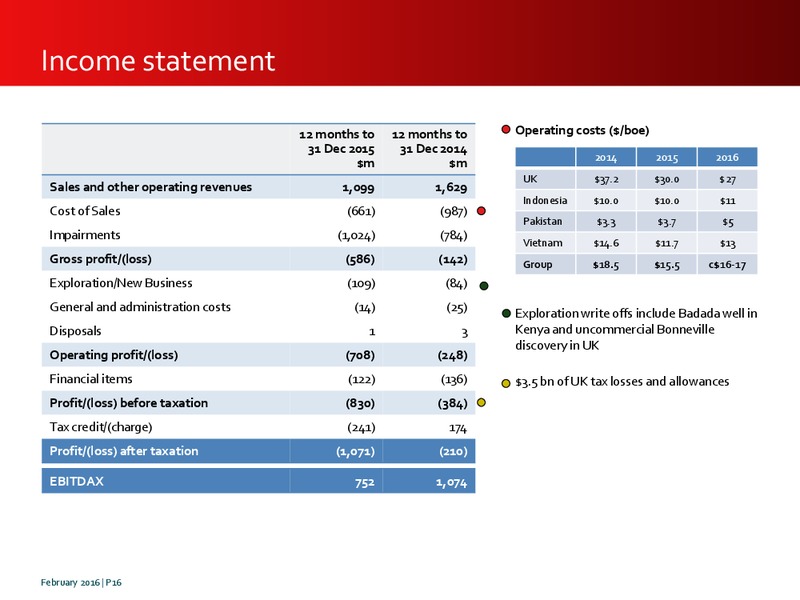
Income statement 12 months to 12 months to Operating costs (/boe) 31 Dec 2015 31 Dec 2014 2014 2015 2016 m m UK 37.2 30.0 27 Sales and other operating revenues 1,099 1,629 Indonesia 10.0 10.0 11 Cost of Sales (661) (987)…
Covenant compliance and mitigating actions Financing Corporate unsecured 1. Covenant position amended structure No reserve base determinations Net debt 2.2 billion Headroom 900m (y/end) No amortisations Strong support from banks &…
Financial benefits of the E.ON acquisition Strong Adds significant cash flow in 2016 and 2017 even at current oil/gas prices cash flow c.15mboepd of net production and associated cash flow added on completion YTD production ahead of…
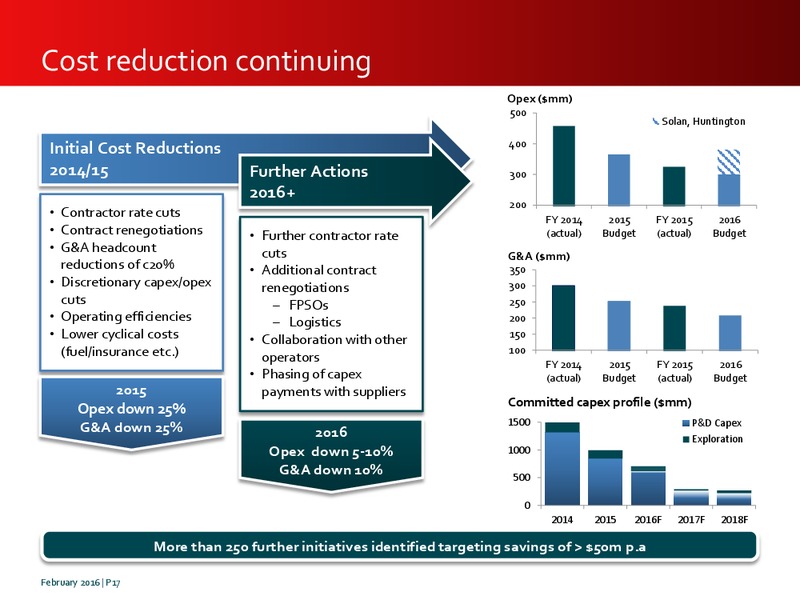
Looking forward Focus on Advantaged Assets UK, SE Asia, Falklands Strategy Disposal of non-core assets Appropriate balance of current cash flow, development projects and longer-term upside Opex (mm) Accelerate Debt Reduction…
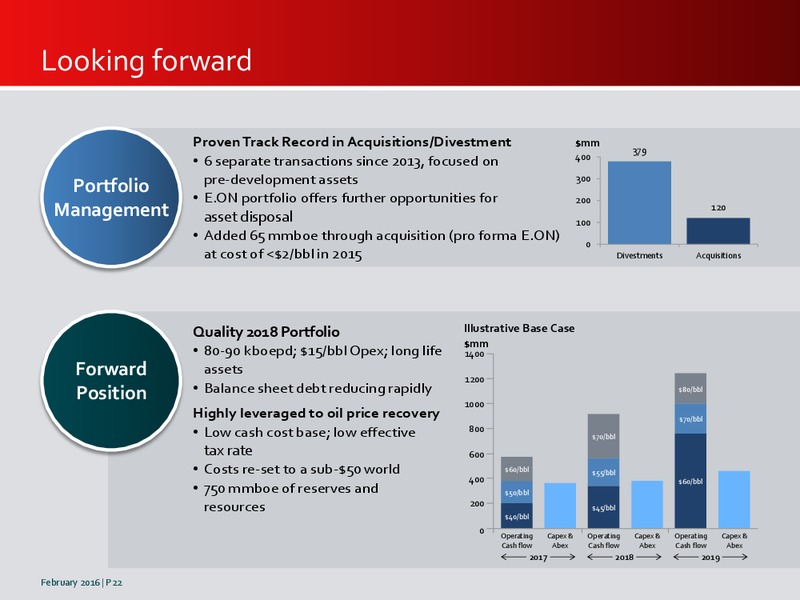
Looking forward Proven Track Record in Acquisitions/Divestment mm 379 6 separate transactions since 2013, focused on 400 pre-development assets 300 Portfolio E.ON portfolio offers further opportunities for 200 Management asset…
 Loading...