Current Environment Increasingly competitive and focused on cost Strong frac sand intensity trends more than offset by reduced well completion activity Extremely competitive environment for all oilfield service providers Sand…
Managing the Downturn Focused on internal cost reductions Key focus on reducing logistics costs and improving origin/destination pairings Temporary idling of Augusta facility to maximize production from lowest cost plants while…
Balance Sheet Remains Strong Strong liquidity Financial flexibility in 000s As of September 30, 2015 Cash 5,035 Revolver1 52,500 Term loan2 195,400 Other notes payable 3,676 Total debt 251,576 Net debt 246,541 Net debt /…
Revolving Credit Facility Amendment Commitment Reduces total commitment to 100 million (from 150 million) Leverage Waives Leverage Ratio during the Effective Period1: 5.00x beginning June 30, 2017 4.50x for the period ending…
Fundamentals Support Strong Long-Term Demand Targeting of shale & unconventional reservoirs Increased use of horizontal drilling More wells per rig Longer laterals More stages per lateral foot More proppant per stage…
Hi-Crushs Competitive Advantages in Current Market Low-Cost Producer 7.51 million tons of 20/100 capacity, including Sponsors Whitehall facility Complementary Distribution Infrastructure Strategic and expanding terminal network…
Our Business Model Q3 2015 Operating Results 51% Sold FOB plant direct 49% to customer FOB Plant Terminal Sold at terminal to Production cost/ton: 11.32 customer Sand delivered to Tons sold: 1,409,032 terminal via rail…
Hi-Crush Ranks Among Largest in Industry 1 7.5 million1 tons current capacity2 in Wisconsin Largest production capacity of frac sand in Wisconsin 4 in World Fourth largest production capacity of frac sand in the…
Logistics Flexibility Critical Access to all major U.S. oil and Sponsors gas basins Whitehall Facility Direct loading and unloading of unit trains Multiple in-basin terminals across Sandstone Formations Marcellus and Utica…
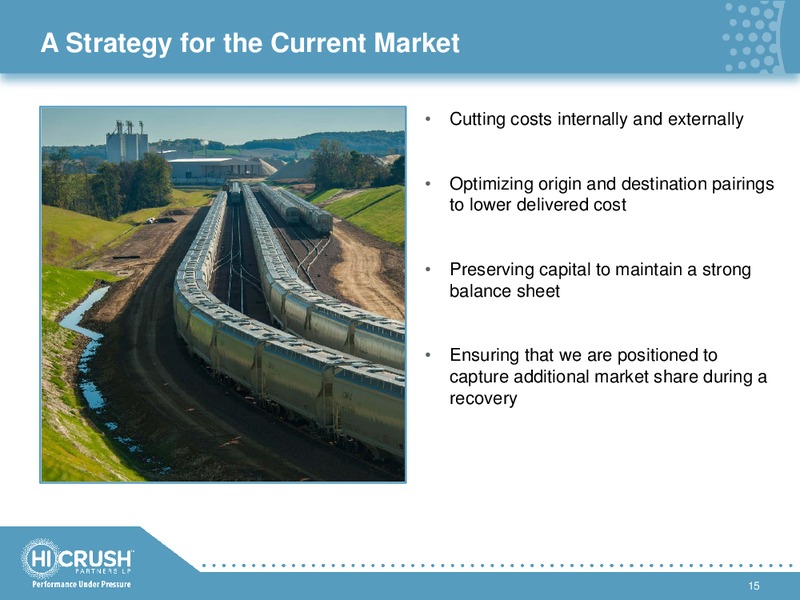
A Strategy for the Current Market Cutting costs internally and externally Optimizing origin and destination pairings to lower delivered cost Preserving capital to maintain a strong balance sheet Ensuring that we are…
Financial Results
3rd Quarter 2015 Summary Unaudited Condensed Consolidated Statements of Operations (Amounts in thousands, except per unit amounts) Three Months Ended September 30, 2015 2014 Revenues 81,494 102,316 Cost of goods sold (including…
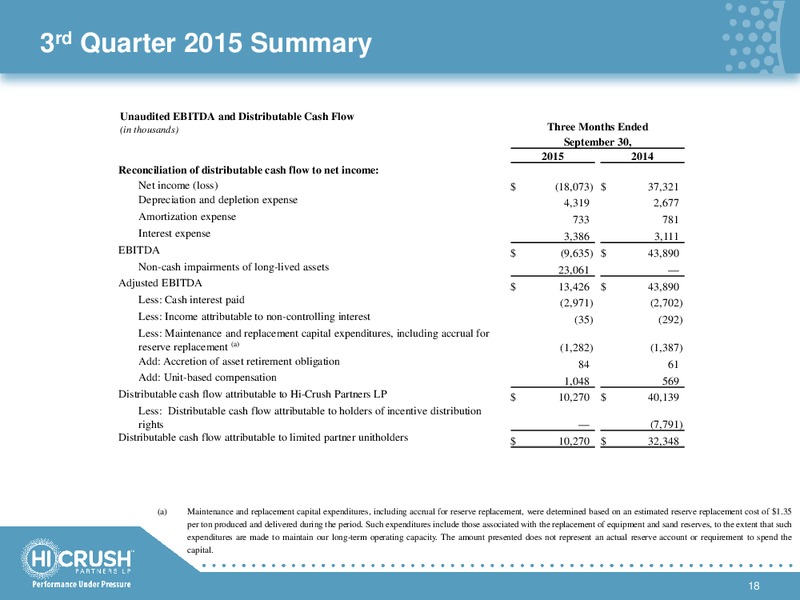
3rd Quarter 2015 Summary Unaudited EBITDA and Distributable Cash Flow (in thousands) Three Months Ended September 30, 2015 2014 Reconciliation of distributable cash flow to net income: Net income (loss) (18,073) 37,321…
YTD 2015 Summary Unaudited Condensed Consolidated Statements of Operations (Amounts in thousands, except per unit amounts) Nine Months Ended September 30, 2015 2014 (a) Revenues 267,563 255,618 Cost of goods sold (including…
YTD 2015 Summary Nine Months Ended Unaudited EBITDA and Distributable Cash Flow (in thousands) September 30, 2015 2014 Reconciliation of distributable cash flow to net income: Net income 17,229 85,646 Depreciation and depletion…
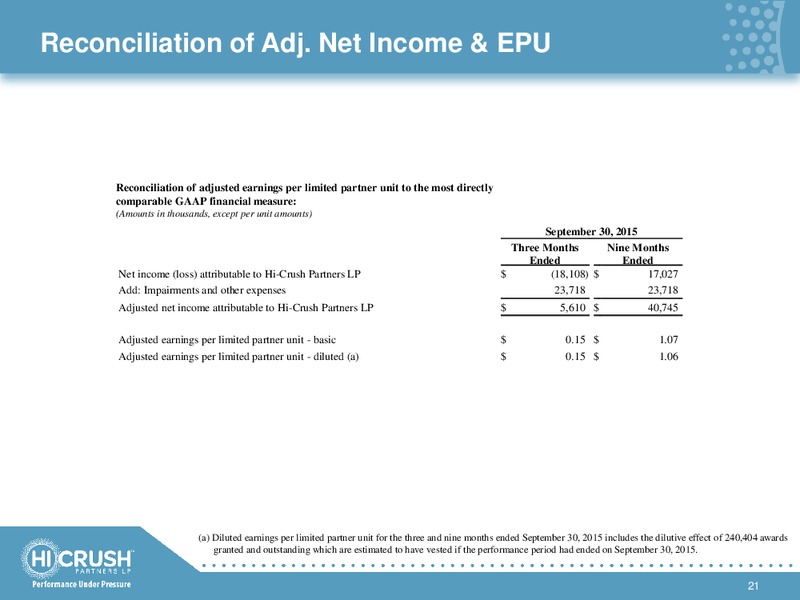
Reconciliation of Adj. Net Income & EPU Reconciliation of adjusted earnings per limited partner unit to the most directly comparable GAAP financial measure: (Amounts in thousands, except per unit amounts) September 30, 2015 Three…
 Loading...