OJSC Rosneft Q4 and FY2013 IFRS Results February 4, 2014 21.08.2014
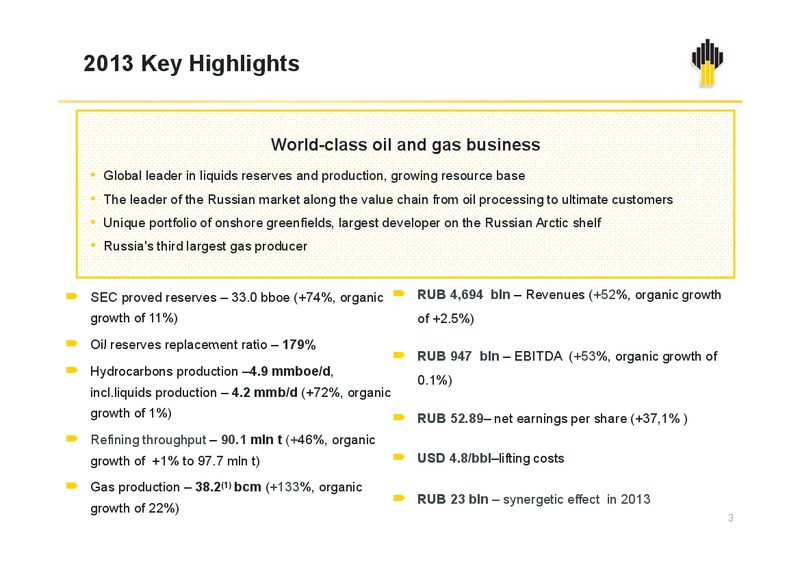
2013 Key Highlights World-class oil and gas business Global leader in liquids reserves and production, growing resource base The leader of the Russian market along the value chain from oil processing to ultimate customers U i…
Key changes in macroeconomic parameters Urals price drop by 2.3% 2 3% to USD 107 107.7/bbl 7/bbl US Dollar appreciation by 2.4% to RUB 31.85/USD Crude base MET rate indexation by 5.4% to RUB 470 Indexation of tariffs for…
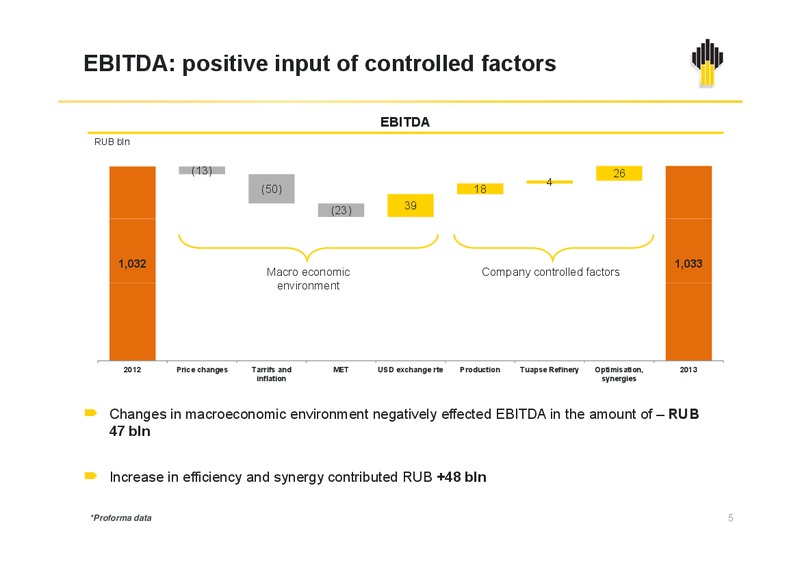
EBITDA: positive input of controlled factors EBITDA RUB bln (13) 26 4 (50) 18 (23) 39 1,032 1,033 Macro economic Company controlled factors environment i t 2012 Price changes Tarrifs and MET USD exchange rte…
CAPEX control and key projects execution CAPEX RUB bln 7.6% decrease in exploration and production 618 593 unit costs up to RUB 226/boe (USD 7.1/boe) Efficient management of CAPEX programme ensured: implementation of timely…
Credit Profile and De-Leveraging Weighted average cost of debt Choice of most effective loan instruments 5.0% 2013 borrowings b i assuredd gradual d l increase in the average tenor of the debt portfolio and reduction of its…
Dividend policy in line with accepted international practices Growth in Rosneft dividends per share Dividend yield,%(2) RUB 6.4 12.86(1) 5.1 4.7 8 05 8.05 7.53 4.5 3.8 3,8 2012 2.76 3.2 1.92 2.30 1.60 1 33 1.33…
Operating results 10
Improved reserves quality and resource renewal on the back of record p production (1) mmboe 1,591 3,556 33,014 (1,732) HC +11%: oil +6% 29,599 gas +29% g 31 12 12 31.12.12 Consolidated production New reserves…
Record oil production as a result of stabilized brownfield output and greenfields progressing on track Daily oil production(1) Opened 6 fields and 70 new deposits mbd +0.8% O Operational i lddrilling illi ffootage 6,082 6 082…
Successful execution of core production projects Samaraneftegaz: growing brownfield Production growth by 2.5%(1) ,5% of the Company production 46 new wells set in operation Active application of the hydrofracturing technology…
Rosneft leader in developing Russian offshore Largest Russian offshore subsoil user : 45 bln toe of resources: Over 20% of World ocean offshore hydrocarbon resources(1) c. 45% of Russian offshore hydrocarbon resources ((2)) 46…
Gas business: world-class resource base and considerable p production growth g Key achievements of 2013 Gas production growth bcm 3-d 3 d largest gas producer in Russia 1 7 SEC gas reserves as of Dec. 31, 2013 amounted to 1.3…
Far East LNG: Pilot project of efficient offshore gas resources monetization Project description Annual capacity 5 mmt Commissioning 2018 Resource base: Sakhalin-1, Severo-Veninsky LB, other perspective LBs (Lebedinsky, (Lebedinsky…
Refining and marketing in Russia: wide geographical presence along the value chain Producing assets Commodity oil flow Refineries Regions under retail coverage Own fuel-filling fuel filling complex Tanker/fuel vessel…
Refinery upgrade Key events in 2013 Euro - 4,5 production by 2015 A record high volume of oil refining in Russia of ca. 85 mln t with a margin of USD6/bbl 28 mln t 18 mln t of Euro-4,5 mogas and diesel was An effect of +18 bln…
Expansion of premium retail and B2B channels Retail network Russian market leader More than 2,400 retail sites in the integrated Company Retail channel efficiency(1) 20% Russian market share (leader) Margin, RUB/t 11 mlnl t annuall…
Integration of acquired assets: taking business to a new level, high operating efficiency, improved asset management Following the assets acquisition, the Company became the world leader among public oil companies p in terms of…
Pro forma key financials for the integrated p y company Pro forma of Key Financials. To facilitate comparability of Rosneft Group performance indicators for the whole calendar year, a pro forma of the integrated companys statements…
 Loading...