CANBRIAM ENERGY INC. CORPORATE PRESENTATION MARCH 2016
Canbriam Energy A fully integrated, BC Montney natural gas growth company with differentiated resource quality Private company focused in the Altares region of the prolific Montney formation in northeast Montney trend BC Fort St.…
The BC Montney has significant offset well density & peer activity Canbriams Altares is located in the northern extension of the prolific BC Montney Montney Wells 30 km Canbriam Energy Montney trend Petronas/Progress -Town…
Differentiated resource quality in the BC Montney Four key attributes that differentiate the Altares Montney 1. Over pressured reservoir Up to 2 times over pressured within Main Fault Block Downhole choke strategy enhances EUR,…
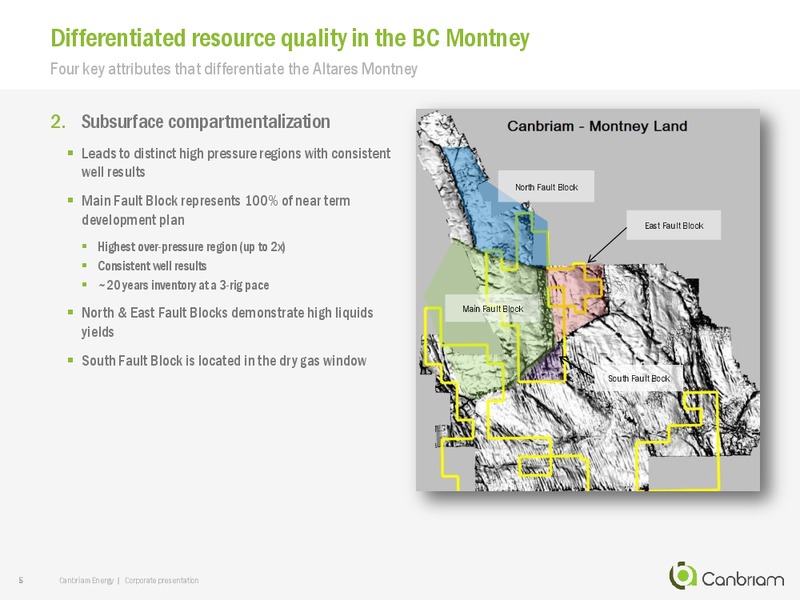
Differentiated resource quality in the BC Montney Four key attributes that differentiate the Altares Montney 2. Subsurface compartmentalization Leads to distinct high pressure regions with consistent well results North Fault…
Differentiated resource quality in the BC Montney Four key attributes that differentiate the Altares Montney 3. Significant thickness 4. Strong liquids component Several zones have been tested three intervals have 2016E liquids…
Drilling inventory supports low-risk production growth Represents 37 years of well inventory at current pace of development Reserve bookings: Liquids rich development locations: +20 years of upside 7 years of inventory at 3 rig pace…
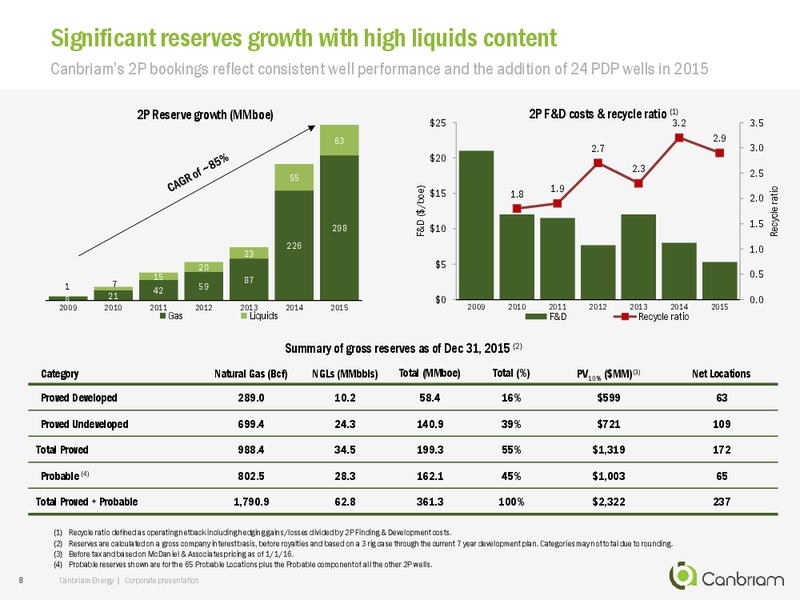
Significant reserves growth with high liquids content Canbriams 2P bookings reflect consistent well performance and the addition of 24 PDP wells in 2015 2P Reserve growth (MMboe) 2P F&D costs & recycle ratio (1) 25 3.2 3.5 63 2.9…
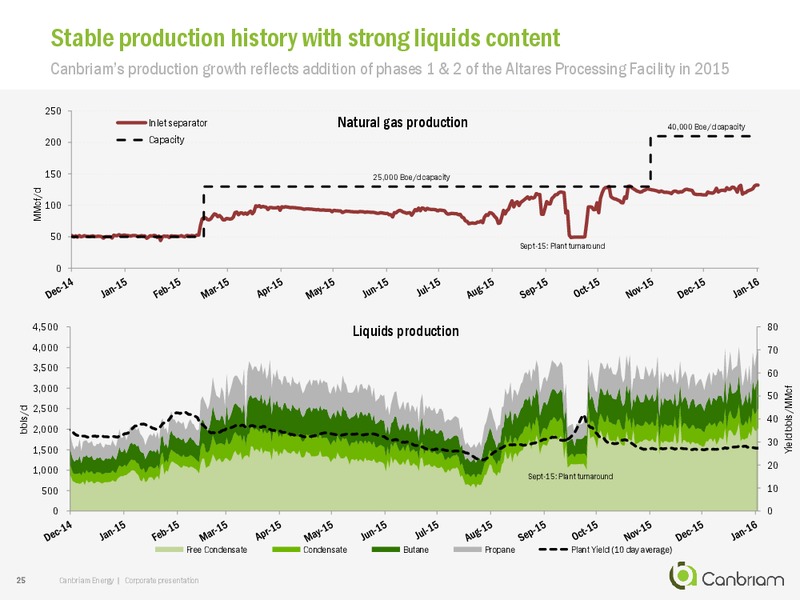
Stable production history with strong liquids content Canbriams production growth reflects addition of phases 1 & 2 of the Altares Processing Facility in 2015 Production history (MBoe/d) 45 Oct 2015: Phase 2 of Natural gas (inlet…
Development plan focused in the prolific Main Fault Block Canbriams Main Fault Block is substantially de-risked and represents the majority of the next 5 years development Daily Raw Gas Production by Well Upper & Lower Montney…
Optimizing well performance through choke management strategy Canbriams use of downhole chokes optimizes its over-pressured reservoir Altares c-B27-H well - Upper Montney Advantages of downhole chokes: 15.0 30,000 Minimizes 1st…
Improving decline rates through choke management Maintenance capital requirement is 50-60 million annually for 25,000 boe/d of production Production by well vintage 24% 20,000 2015H1 corporate 2014 decline rate 2013 2012…
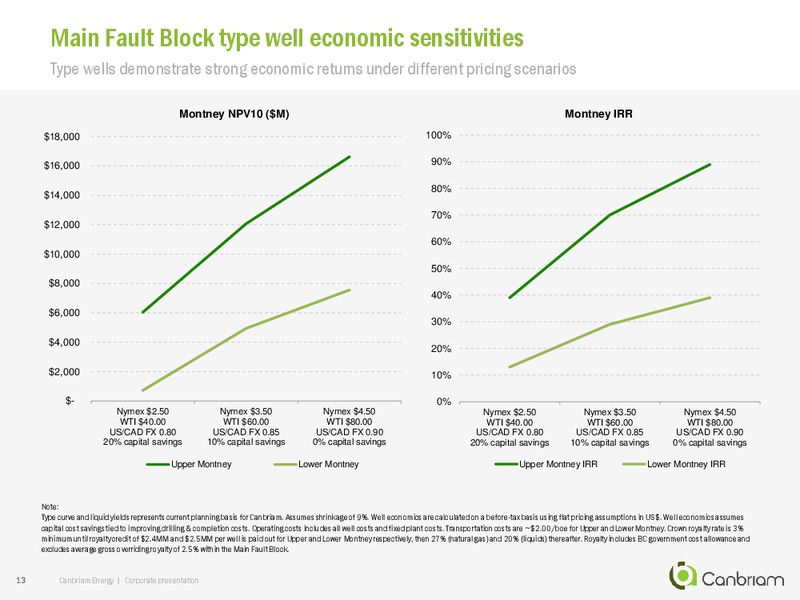
Main Fault Block type well economic sensitivities Type wells demonstrate strong economic returns under different pricing scenarios Montney NPV10 (M) Montney IRR 18,000 100% 16,000 90% 80% 14,000 70% 12,000 60% 10,000 50%…
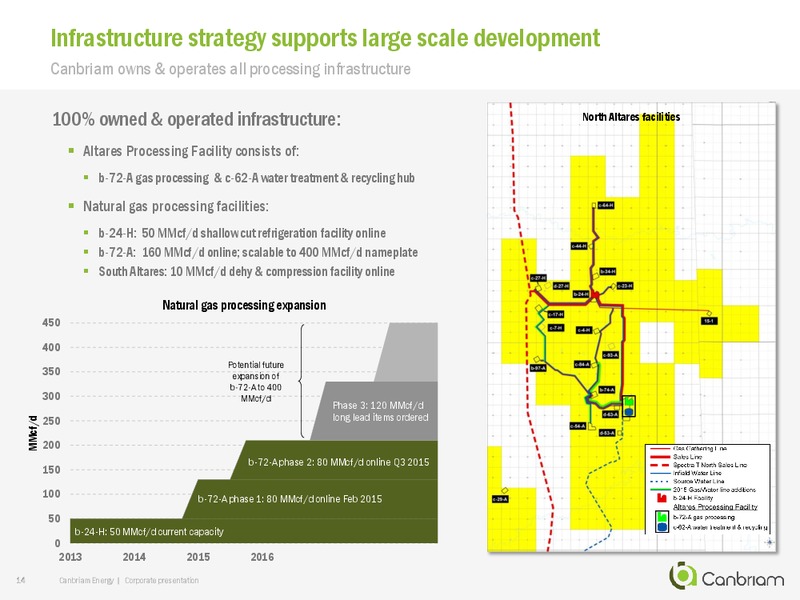
Infrastructure strategy supports large scale development Canbriam owns & operates all processing infrastructure 100% owned & operated infrastructure: North Altares facilities Altares Processing Facility consists of: b-72-A gas…
Altares Processing Facility: scalable to 400 MMcf/d Canbriam owns & operates all processing infrastructure Water treatment & recycling hub Commissioned March 2015 Phase 4: 120 MMcf/d Sanctioning to be determined Phase 3: 120…
Integrated water solution is a strategic advantage Demonstrates robust economics, eliminates need to truck water and provides benefits to stakeholders Canbriam water infrastructure capital cost (MM) 1. Sourcing Project descriptions…
Marketing plan supports long term development Canbriam benefits from competitive royalties, supportive stakeholders and easily accessible infrastructure Sufficient takeaway capacity: Spectra T North Gas transmission Spectra T North:…
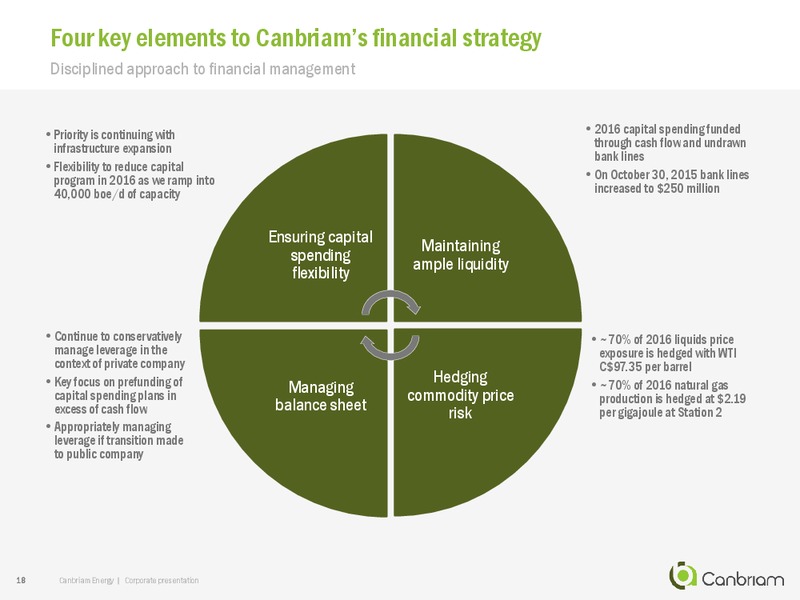
Four key elements to Canbriams financial strategy Disciplined approach to financial management Priority is continuing with 2016 capital spending funded infrastructure expansion through cash flow and undrawn bank lines Flexibility…
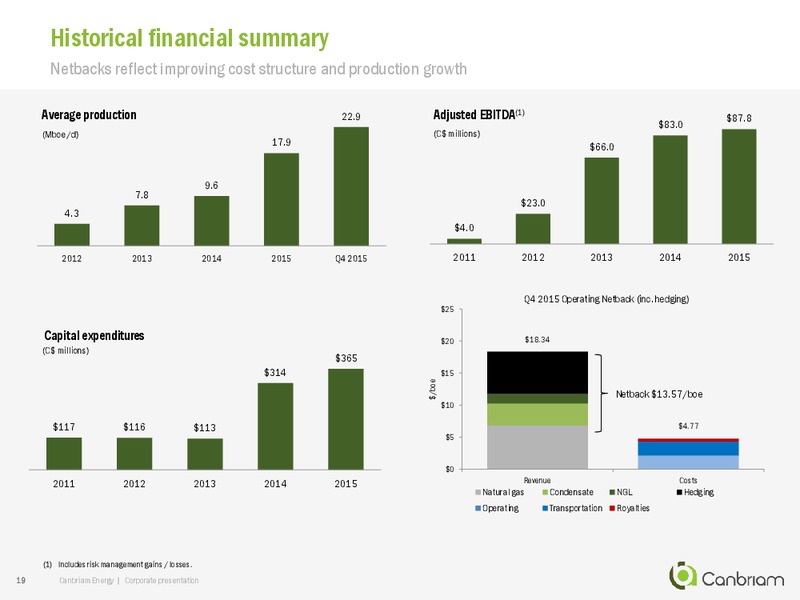
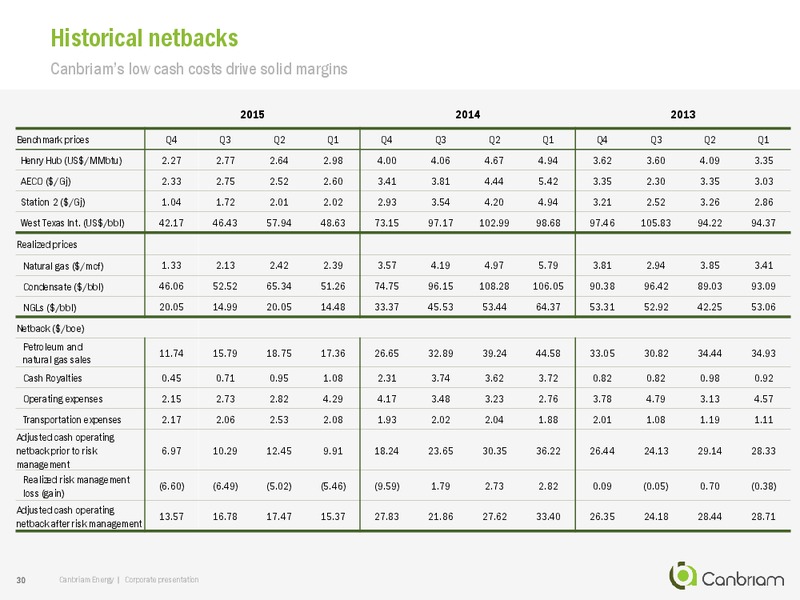
Historical financial summary Netbacks reflect improving cost structure and production growth Average production 22.9 Adjusted EBITDA(1) 87.8 83.0 (Mboe/d) (C millions) 17.9 66.0 9.6 7.8 23.0 4.3 4.0 2012 2013 2014 2015 Q4…
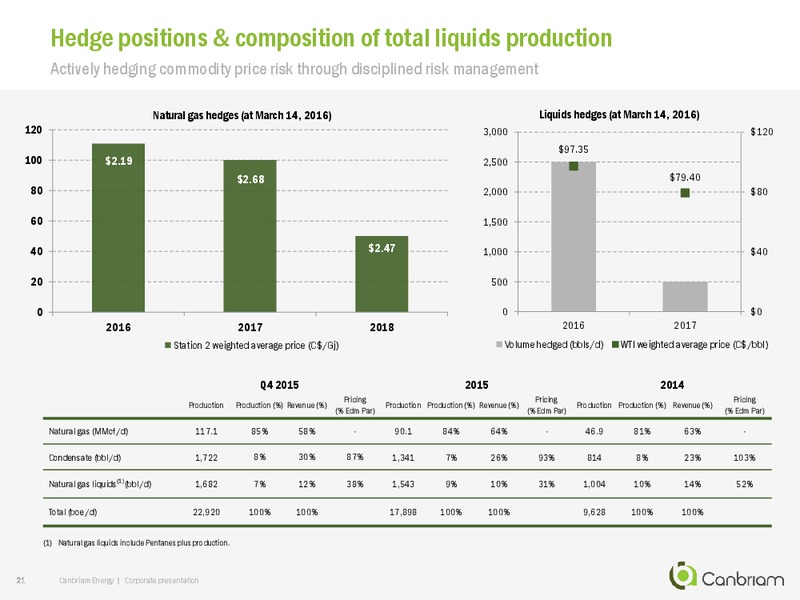
Hedge positions & composition of total liquids production Actively hedging commodity price risk through disciplined risk management Natural gas hedges (at March 14, 2016) Liquids hedges (at March 14, 2016) 120 3,000 120 97.35 100…
Investing in Canbriam Energy A fully integrated, natural gas growth company with differentiated resource quality Prolific EUR/well with 1,100 of Montney vertical thickness on 62,000 (50% liquids rich) net acres 199.3 MMboe of gross…
Stable production history with strong liquids content Canbriams production growth reflects addition of phases 1 & 2 of the Altares Processing Facility in 2015 250 Inlet separator Natural gas production 40,000 Boe/d capacity 200…
Proven ability to manage over-pressured reservoir Canbriams Altares Montney is up to 2 times over-pressured Development plan supported by: 1. Safe operating procedures Plug & Perf is the lowest risk completion technique for over…
Type curve economics Upper Montney Canbriams Upper Montney wells have exceeded type curve performance Drilling locations(1) 284 6,000 Well properties Raw gas type curve (Bcf)(2) 9.0 5,000 Sales gas (Bcf)(3) 8.2 Raw Gas…
Type curve economics Lower Montney Lower Montney performance reflects over-pressured reservoir Drilling locations(1) 149 6,000 Well properties 5,000 Raw gas type curve (Bcf)(2) 8.0 Sales gas (Bcf)(3) 7.3 Raw Gas Production Rate…
Supplemental reserves information 2015 Independent reserves evaluation completed by McDaniel & Associates Reserves Reconciliation (1) Proved Probable Proved + Probable Natural Gas NGLs Total Natural Gas NGLs Total Natural Gas NGLs…
Upper Montney Main Fault Block well performance Canbriams near term development plan is focused primarily in the Main Fault Block Daily Raw Gas Production by well - Upper Montney Main Fault Block Development Wells 10,000 b-A24-H…
 Loading...