Skip to main content Q4 2015 Results – Orlen Upstream Investor Presentation | Shale Experts
Loading...

Q4 2015 Results – Orlen Upstream

Orlen Upstream · Jan 28, 2016 · 36 slides

Investor presentation from the Shale Experts oil & gas presentation and slide database. Every page is imaged and its text indexed for search across operators, plays, basins and time.

Slides

  1. Q4 2015 Results – Orlen Upstream – slide 1
    PKN ORLEN consolidated financial results 4Q15 28 January 2016 ORLEN4Q15PKN_ORLEN
  2. Q4 2015 Results – Orlen Upstream – slide 2
    Agenda Key highlights 2015 Macroeconomic environment Financial and operating results Liquidity and investments Market outlook for 2016 2
  3. Q4 2015 Results – Orlen Upstream – slide 3
    Key highlights 2015 Value creation Financial strength EBITDA LIFO: PLN 8,7 bn* Financial gearing: 28,1% Record-high throughput 30,9 mt and sales 38,7 mt Cash flow from operations: PLN 5,4 bn M&A of upstream assets in Canada and…
  4. Q4 2015 Results – Orlen Upstream – slide 4
    Agenda Key highlights 2015 Macroeconomic environment Financial and operating results Liquidity and investments Market outlook for 2016 4
  5. Q4 2015 Results – Orlen Upstream – slide 5
    Macro environment in 4Q15 (y/y) Downstream margin decrease Product slate of downstream margin Model downstream margin, USD/bbl Crack margins Refining products (USD/t) 4Q14 3Q15 4Q15 (y/y) Diesel 122 108 85 -30% -0,6 USD/bbl Gasoline…
  6. Q4 2015 Results – Orlen Upstream – slide 6
    Diesel consumption increase correlated with GDP increase GDP increase1 Fuel consumption (diesel, gasoline)2 Change (%) to respective quarter of the last year mt 4Q14 1Q15 2Q15 3Q15 4Q15 4Q14 4Q15 4Q14 4Q15 + 6% + 3% 3,3 3,7 3,3 3,5…
  7. Q4 2015 Results – Orlen Upstream – slide 7
    Agenda Key highlights 2015 Macroeconomic environment Financial and operating results Liquidity and investments Market outlook for 2016 7
  8. Q4 2015 Results – Orlen Upstream – slide 8
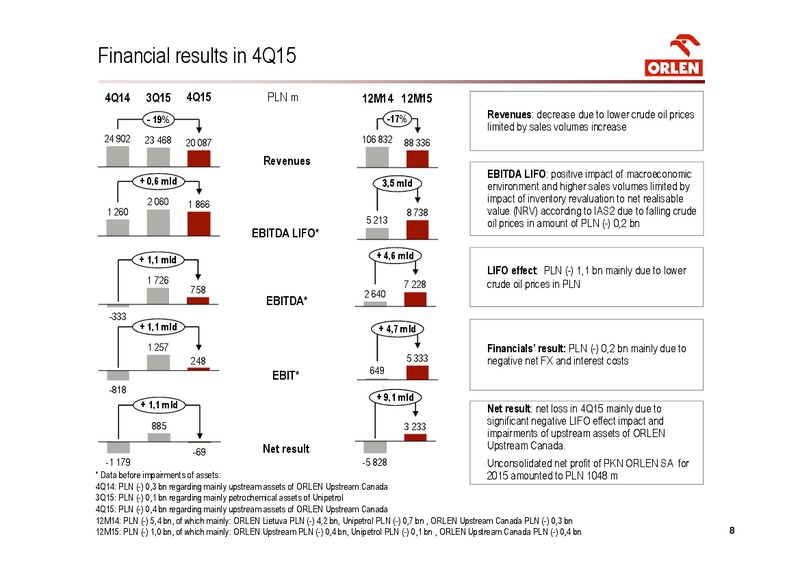
    Financial results in 4Q15 4Q14 3Q15 4Q15 PLN m 12M14 12M15 - 19% -17% Revenues: decrease due to lower crude oil prices limited by sales volumes increase 24 902 23 468 20 087 106 832 88 336 Revenues EBITDA LIFO: positive impact of…
  9. Q4 2015 Results – Orlen Upstream – slide 9
    EBITDA LIFO Segments results in 4Q15 Positive impact (y/y) of: PLN m sales increase by 5% 369 7 1 866* macro environment improvement mainly due to weakening of PLN 1 656 -166 against USD by 16% and lower costs of internal consumption…
  10. Q4 2015 Results – Orlen Upstream – slide 10
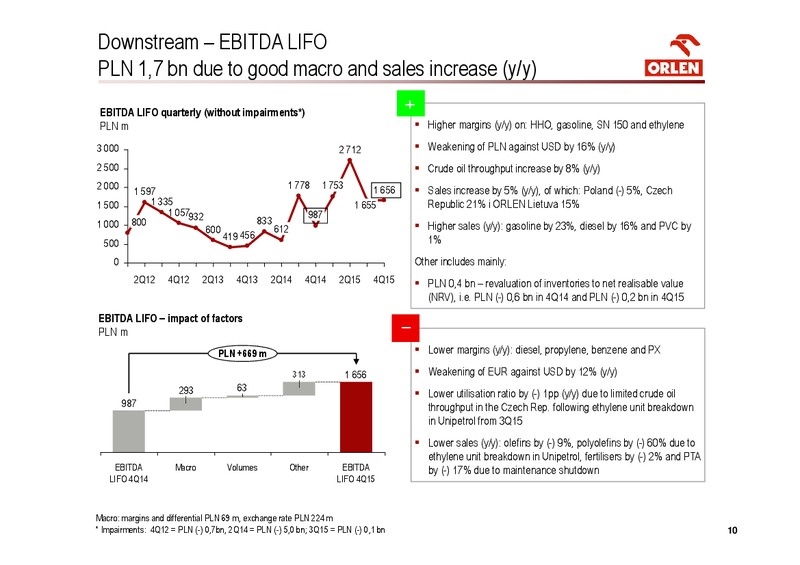
    Downstream EBITDA LIFO PLN 1,7 bn due to good macro and sales increase (y/y) EBITDA LIFO quarterly (without impairments*) + PLN m Higher margins (y/y) on: HHO, gasoline, SN 150 and ethylene 3 000 2 712 Weakening of PLN against USD by…
  11. Q4 2015 Results – Orlen Upstream – slide 11
    Downstream operational data Higher crude oil throughput by 8% and sales by 5% (y/y) Sales volumes Utilization ratio mt % 9 + 5% Refineries 4Q14 3Q15 4Q15 (y/y) 8,1 Pock 89% 104% 94% 5 pp 8 7,9 7,6 7,6 7,7 Unipetrol 88% 85% 72% -16 pp…
  12. Q4 2015 Results – Orlen Upstream – slide 12
    Downstream Energy projects realization (industry cogeneration) Strategic assumptions Building a CCGT plant in Wloclawek (463 MWe) Industry cogeneration projects with the highest profitability / the In 4Q15 finalisation of start-up works…
  13. Q4 2015 Results – Orlen Upstream – slide 13
    Retail EBITDA LIFO Sales increase by 3% at lower fuel margins (y/y) EBITDA LIFO quarterly (without impairments) PLN m + Sales increase by 3% (y/y) 600 539 451 Market share increase in the Czech Rep. and Lithuania 500 441 (y/y) 369 379…
  14. Q4 2015 Results – Orlen Upstream – slide 14
    Retail operational data Sales increase and further growth of non-fuel offer Sales volumes Number of petrol stations and market shares (by volume) mt , % 2,5 + 3% 2,1 2,1 2,1 2,0 2,0 2,0 2,0 2,0 2,0 1,9 1,9 1,9 1,9 1,8 1,7 1,8…
  15. Q4 2015 Results – Orlen Upstream – slide 15
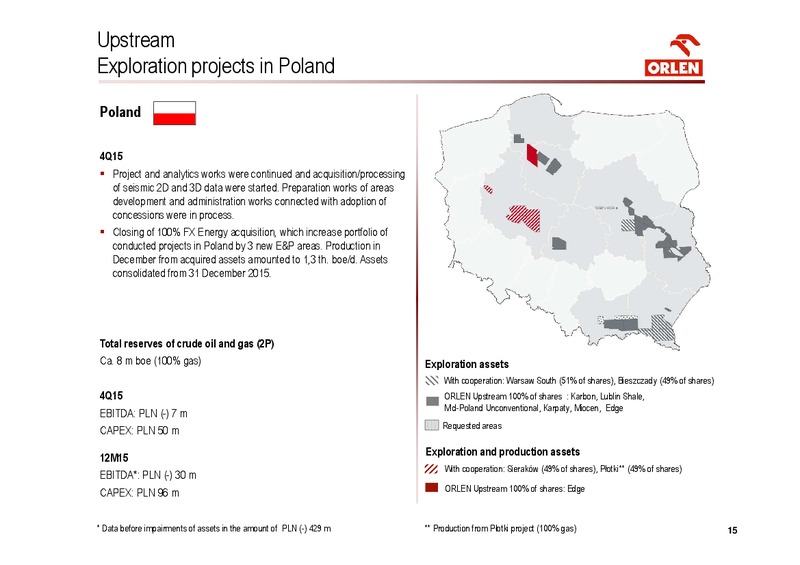
    Upstream Exploration projects in Poland Poland 4Q15 Project and analytics works were continued and acquisition/processing of seismic 2D and 3D data were started. Preparation works of areas development and administration works…
  16. Q4 2015 Results – Orlen Upstream – slide 16
    Upstream Production projects in Canada Canada 4Q15 Drilling of 2 new wells (1,7 net*) were started, 3 fracking (3,0 net*) were done and 5 wells (5,0 net*) were included to production Closing acquisition of Kicking Horse Energy Ltd.,…
  17. Q4 2015 Results – Orlen Upstream – slide 17
    Agenda Key highlights 2015 Macroeconomic environment Financial and operating results Liquidity and investments Market outlook for 2016 17
  18. Q4 2015 Results – Orlen Upstream – slide 18
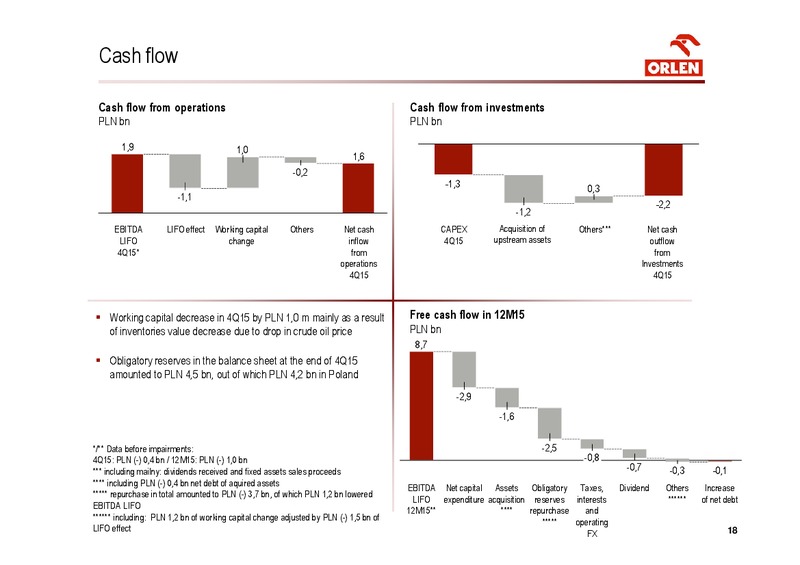
    Cash flow Cash flow from operations Cash flow from investments PLN bn PLN bn 1,9 1,0 1,6 -0,2 -1,3 0,3 -1,1 -2,2 -1,2 EBITDA LIFO effect Working capital Others Net cash CAPEX Acquisition of Others*** Net cash LIFO change…
  19. Q4 2015 Results – Orlen Upstream – slide 19
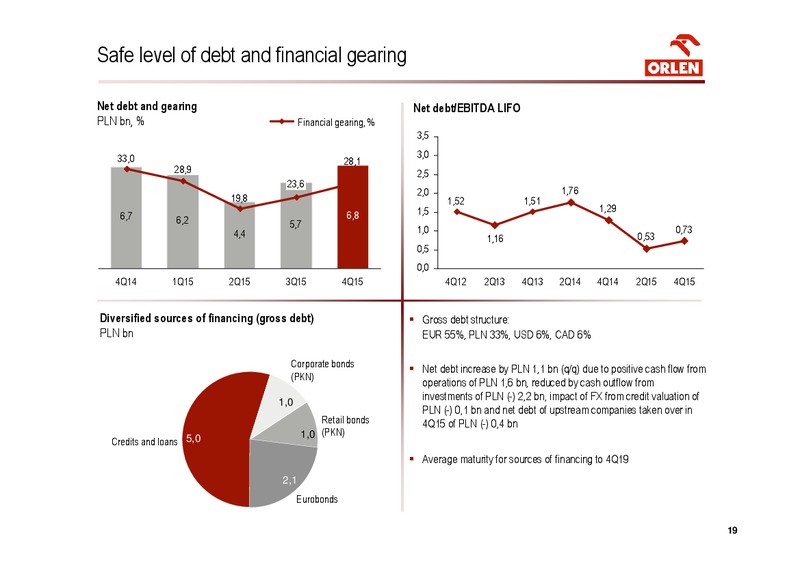
    Safe level of debt and financial gearing Net debt and gearing Net debt/EBITDA LIFO PLN bn, % Financial gearing, % 3,5 33,0 3,0 28,1 28,9 2,5 23,6 2,0 1,76 19,8 1,52 1,51 1,5 1,29 6,7 6,2 6,8 5,7 4,4 1,0 0,73 1,16 0,53 0,5…
  20. Q4 2015 Results – Orlen Upstream – slide 20
    Capital expenditures Planned CAPEX in 2015 Realised CAPEX 12M15 split by segments PLN bn, % PLN m 205 3183** 3,8 288 448 Downstream 66% 5,8 Retail 2242 9% Growth 2,5 5,1 Energy* 1089 25% Petrochemicals 529 Maintenance…
  21. Q4 2015 Results – Orlen Upstream – slide 21
    Agenda Key highlights 2015 Macroeconomic environment Financial and operating results Liquidity and investments Market outlook for 2016 21
  22. Q4 2015 Results – Orlen Upstream – slide 22
    Plans for 2016 Planned CAPEX * in 2016 (base case scenario) Main growth projects in 2016 PLN bn, % Downstream 4,8** Building of CCGT in Pock Building of Polyethylene Unit (PE3) in the Czech Republic 5,8 Retail Downstream 64% 10%…
  23. Q4 2015 Results – Orlen Upstream – slide 23
    Market outlook for 2016 Macroeconomic environment Economy Brent crude oil price in base case scenario crude oil price is GDP outlook for Poland: 3,6% in 2015; 3,3% in 2016 and 3,5% expected at comparable level to an average crude oil…
  24. Q4 2015 Results – Orlen Upstream – slide 24
    Thank You for Your attention For more information on PKN ORLEN, please contact Investor Relations Department: phone: + 48 24 256 81 80 fax: + 48 24 367 77 11 e-mail: irorlen.pl www.orlen.pl

  25. Q4 2015 Results – Orlen Upstream – slide 25
    Agenda Supporting slides 25 25
  26. Q4 2015 Results – Orlen Upstream – slide 26
    Results split by quarters PLN m 4Q14 3Q15 4Q15 y/y 12M14 12M15 Revenues 24 902 23 468 20 087 -19% 106 832 88 336 -17% EBITDA LIFO* 1 260 2 060 1 866 48% 5 213 8 738 68% Effect LIFO -1 593 -334 -1 108 30% -2 573 -1 510 41% EBITDA*…
  27. Q4 2015 Results – Orlen Upstream – slide 27
    Results split by segments 4Q15 Corporate Downstream Retail Upstream Total PLN m Functions EBITDA LIFO* 1 656 369 7 -166 1 866 Effect LIFO -1 108 - - - -1 108 EBITDA* 548 369 7 -166 758 Depretiation -327 -95 -64 -24 -510 EBIT* 221…
  28. Q4 2015 Results – Orlen Upstream – slide 28
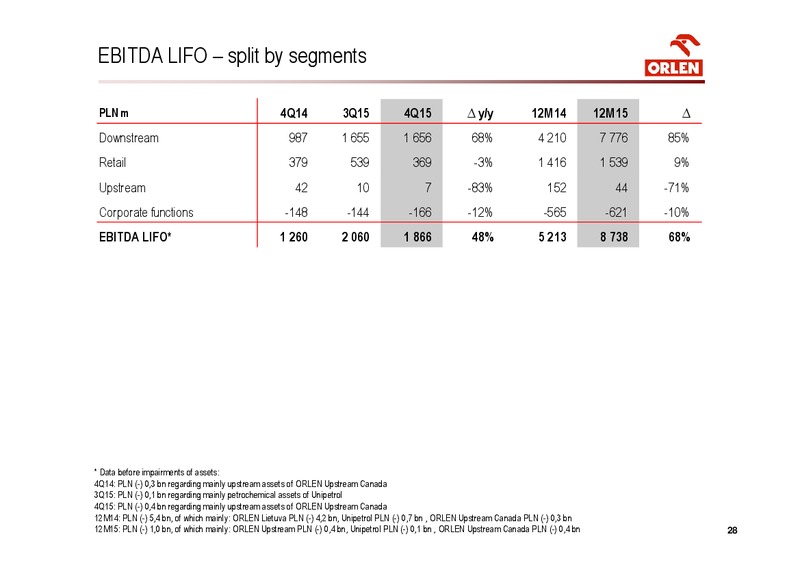
    EBITDA LIFO split by segments PLN m 4Q14 3Q15 4Q15 y/y 12M14 12M15 Downstream 987 1 655 1 656 68% 4 210 7 776 85% Retail 379 539 369 -3% 1 416 1 539 9% Upstream 42 10 7 -83% 152 44 -71% Corporate functions -148 -144 -166 -12% -565…
  29. Q4 2015 Results – Orlen Upstream – slide 29
    Results - split by companies Others and 4Q15 ORLEN consolidation PLN m PKN ORLEN S.A. Unipetrol 2) Lietuva 2) corrections Total Revenues 13 229 3 615 3 706 -463 20 087 EBITDA LIFO* 1 323 129 74 340 1 866 Effect LIFO1) -1 112 -15…
  30. Q4 2015 Results – Orlen Upstream – slide 30
    ORLEN Lietuva Group Key elements of the profit and loss account USD m 4Q14 3Q15 4Q15* y/y 12M14* 12M15 Revenues 1 414 1 057 953 -33% 6 222 4 138 -33% EBITDA LIFO -86 29 20 - -74 289 - EBITDA -58 54 25 - -74 295 - EBIT -61 51 21 -…
  31. Q4 2015 Results – Orlen Upstream – slide 31
    UNIPETROL Group Key elements of the profit and loss account CZK m 4Q14* 3Q15 4Q15* y/y 12M14* 12M15* Revenues 28 939 29 452 22 956 -21% 124 229 108 907 -12% EBITDA LIFO 2 573 3 597 824 -68% 7 857 11 604 48% EBITDA 1 303 3 066 725 -44% 6…
  32. Q4 2015 Results – Orlen Upstream – slide 32
    Macro environment in 1Q16 Downstream margin increase Product slate of downstream margin Model downstream margin, USD/bbl Crack margins Refining products (USD/t) 1Q15 4Q15 1Q16* (q/q) (y/y) +1,4 USD/bbl Diesel 123 85 56 -34% -54%…
  33. Q4 2015 Results – Orlen Upstream – slide 33
    Macro environment in 1Q16 Refining margin and B/U differential increase Petrochemical margin increase Model refining margin and Brent/Ural differential, USD/bbl Model petrochemical margin, EUR/t differential margin + 94 EUR/t + 1,4…
  34. Q4 2015 Results – Orlen Upstream – slide 34
    Production data 4Q14 3Q15 4Q15 y/y q/q 12M14 12M15 Total crude oil throughput in PKN ORLEN (tt) 7 221 8 332 7 776 8% -7% 27 276 30 908 13% Utilization in PKN ORLEN 89% 95% 88% -1 pp -7 pp 84% 90% 6 pp Refinery in Poland 1 Processed…
  35. Q4 2015 Results – Orlen Upstream – slide 35
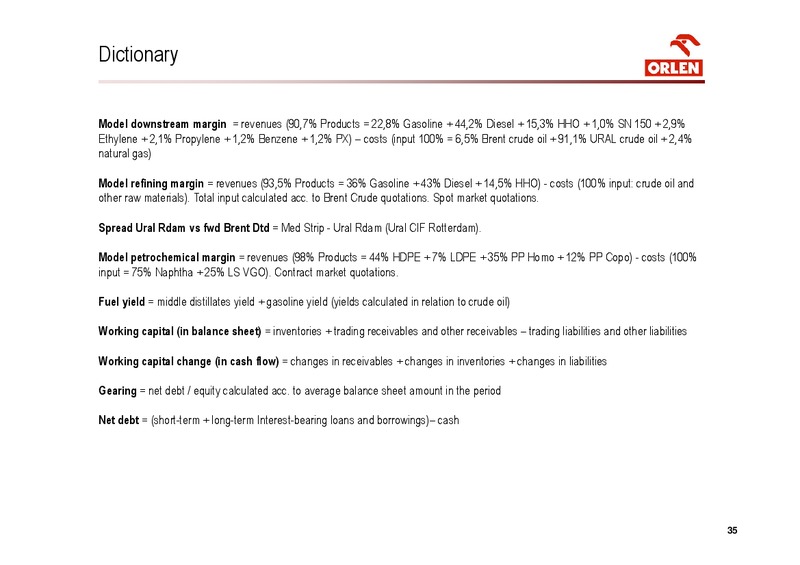
    Dictionary Model downstream margin = revenues (90,7% Products = 22,8% Gasoline + 44,2% Diesel + 15,3% HHO + 1,0% SN 150 + 2,9% Ethylene + 2,1% Propylene + 1,2% Benzene + 1,2% PX) costs (input 100% = 6,5% Brent crude oil + 91,1% URAL…
  36. Q4 2015 Results – Orlen Upstream – slide 36
    For more information on PKN ORLEN, please contact Investor Relations Department: phone: + 48 24 256 81 80 fax: + 48 24 367 77 11 e-mail: irorlen.pl www.orlen.pl

From the store

Browse maps, data & reports in the Shale Experts store