2015 DATA OMV Petrom is an operationally integrated oil & gas company Upstream Downstream Oil Romania Petrobrazi refinery (4.5 mn t/yr capacity) 3.81 mn toe/yr crude oil and NGL 2.5 mn t retail sales 5.27 bcm/yr gas 788 filling…
2015 DATA1 OMV Petrom is the leading industrial company in Romania One of the largest private Main energy supplier employers Accounts for 40% of oil, gas 16,000 direct employees and and fuel supply, and can cover more than 50,000…
2015 DATA OMV Petrom has transformed from an inefficient state- owned company into a high-performing private company From... To... Impact Professional organization State company mindset Transparency Corporate Two-tier management…
High safety and efficiency focus LTIR1 Romania Operational safety our top priority LTIR substantially improved 1.6 2015: the lowest level since privatization Lower than IOGP2 international benchmark 60% reduction 0.8 Significant…
Financial performance in 2015 Clean CCS EBIT 2015 vs 2014 Upstream (RON mn) -52% Production slightly lower 5,202 Exploration expenses increased Significantly depressed oil prices 4,667 2,522 Downstream Oil 919 High refining…
Shareholder structure and capital market environment OMV Petrom S.A. shareholder structure1 OMV2: Austrias largest listed industrial company and integrated international oil and gas company 18.99% Fondul Proprietatea: listed fund, 85%…
Business environment in 2015 Latest available data International environment Romania: good macroeconomics Oil price: - 47% yoy 2015 GDP growth2: +3.7% Oil demand and supply in Europe1: CPI annual inflation3:12-month avg. -1%…
Dynamics of the Romanian energy sector in 2015 Demand1 Fuels2 +5%; Gas -5%; Power3 +2% Demand and prices Prices Urals: -47% 2015 vs 2014 Gas: HH4 +8%, deregulation continued; NHH5 liberalized Power6: +5% Downstream Gas Mandatory…
OMV PETROM STRATEGY AS OF 2012 Strategy 2021: Sustainable performance for growth Upstream Maximize portfolio value and position for growth We aim to remain the leading Downstream Gas regional, integrated oil and gas Enhance…
We have delivered on our objectives 2012 - 2015: DELIVERED Stabilize production through field redevelopment, drilling, workovers Continue with operational excellence Optimize Upstream portfolio through partnerships Explore and…
Upstream Key indicators for 2015 24% Production cost1 reduction yoy Production very close to the level of 2014 35% CAPEX (incl. E&A2) reduction yoy 7* Deep offshore wells in the Neptun Block 35% Three year average RRR3…
Upstream OMV Petrom footprint is concentrated in Romania 2015 DATA Exploration and production concessions Key facts Romania Existing blocks/fields: 9 assets with 232 commercial oil and gas fields (45/55% oil/gas mix) and 8,200…
Upstream Production largely maintained due to past investments and discoveries Production in Romania, kboe/d 2015 production relatively stable: FRDs (incl. Totea) contribution to up to -4%1 production increased by 60% vs 2014 174 174…
Upstream Transforming additional reserves into production 1P Reserves and additions/year, mn boe Production from FRD investments1, kboe/d 1,000 300 30 805 786 750 707 671 625 20 500 150 10 0 0 0 2010 2011 2012 2013 2014…
Upstream Clear focus on operational improvements Mean Time between Failure (MTBF), days Production losses, kboe/d 500 20 OeX1 1 15 263 Pump optimization -10% 10 19 16 16 148 14 13 12 Well modernization 5 36 Do…
Upstream: Mid-term production FRD projects to unlock growth potential 2015 DATA 12 FRDs in development phase continue FRDs aim at maximizing ultimate recovery EOR/IOR (water, steam, polymer injection) 2P reserves of 130 mn boe…
Upstream FRD Lebada East project to start production in 2016 Final Investment Decision of EUR 60 mn made in 2014 Optimize exploitation by upgrading existing non-associated (NAG) gas compression system First execution stage…
Upstream Exploration and partnerships efforts to rejuvenate production base is paying off 2015 DATA 3D seismic coverage of 2D and 3D Seismic exploration acreage 79% in 2015 (from 3% in 2005) 2 Near-field and frontier exploration…
Upstream Strong position in the Black Sea Romania Neptun Deep JV established in 2008: OMV Petrom (50%), ExxonMobil (50%,Operator ) Total investment in excess of USD 1.5 bn since 2008 (thereof 50% OMV Petrom) First exploration…
Downstream Oil Contribution to Group results proves integration benefits Downstream Oil share of OMV Petrom OMV Petrom Indicator refining margin and Groups Clean CCS EBIT Fuel & Loss 15 12.7 15 6% 9.1 10 10 52% 8.7 5 5 0.3 1.9 0…
Downstream Oil Sales performance Non-oil products contribution to retail Market position in Romania in 20151 margin in 2015 13% 19% Retail 1 Wholesale 2 OMV Petrom Group Average CEE2 Aviation 1 Oil products Non-Oil Products…
Downstream Gas Good operational results in a weak market environment Gas sales, TWh Net electrical output, TWh 52.7 51.4 2.9 47.7 2.7 6.5 6.1 3.4 1.3 46.2 44.3 45.2 2013 2014 2015 2013 2014 2015 Internal sales Sales to…
Q4/15 overview Clean CCS EBIT, RON mn Q4/15 vs Q4/14 -79% 1,026 Average Urals crude prices down 44% to USD 42.26/bbl RON weaker vs USD by 15% 532 Group production at 176 kboe/d 211 Higher exploration expenses 230 277 Higher…
Revised market outlook triggered significant impairments in Upstream in 2015 OMV Petrom oil price assumptions, USD/bbl Impairments in Upstream in 2015, RON mn 2nd Revision (Q4/15) Original planning assumption (2014) 2,700 1st…
Special items and CCS effect Q4/15 (RON mn) RON mn Q4/15 Q4/14 Clean CCS EBIT 211 1,026 211 CCS gains/ (losses) (125) (156) (125) (8) Clean EBIT 85 870 Personnel related costs (8) (27) Other impairments (1,997) (917) (1,997) Other…
Clean CCS net income Clean CCS net income attribu- RON mn Q4/15 Q4/14 table to stockholders (RON mn) EBIT (1,844) (111) n.m. Financial result (135) (167) (19)% -90% 668 Taxes 299 (30) n.m. Effective tax rate 15% (11)% n.m. Net…
Cash flow 2015 (RON mn) in RON mn 2015 2014 Profit/(loss) before taxation (726) 2,909 n.m. Depreciation, amortization and 6,761 4,806 41% 146 (729) impairments Net interest paid (104) (61) 70% Tax on profit paid (729) (927) (21)%…
CAPEX and EBITD 2015 (RON mn) Key investment projects 6,231 Upstream: Field redevelopment executions, workover activities, drilling as well as investments related to Neptun Deep project 3,895 4,099 Downstream Oil: 3+3 terminals…
Downstream Gas KPIs Gas sales1 (TWh) 16.7 14.3 13.3 10.6 10.9 Q4/15 vs Q4/14 Gas sales volumes slid by 7% mainly due to lower chemical industry demand, despite higher Q4/14 Q1/15 Q2/15 Q3/15 Q4/15 off-take by the Brazi power…
OMV Petrom 2015: Resilient in highly volatile market Safe operations: Record low LTIR, below international benchmark Good operational performance Hydrocarbon production broadly stable Neptun Deep exploration successfully completed1…
2015: Efficiency and optimization programs in place, with significant results achieved 2015 vs 2014 Upstream Production Reduced by USD 4.1/boe, from - 24 % Costs (USD/boe) USD 17.3/boe to USD 13.2/boe1 Downstream Direct Reduced…
Upstream Reduced OMV Petrom Group OPEX to a new level Production costs, USD/boe 2015 OPEX reduced by 24% vs 2014: Favorable FX effects Shutdown of uneconomic wells Improved running time of pumping units Resizing of the workover…
Upstream CAPEX adjusted to the low oil price environment Upstream CAPEX, EUR mn 2015 CAPEX reduced by 35% yoy: Prioritize investments 1,204 E&A offshore maintained, lower onshore 2016: Flexibility to reduce further 784 Planning…
Outlook 2016 Oil price: Brent annual average estimated at USD 40/bbl International market Refining margin: To decline from 2015 levels Fuels: Demand supported by low prices & VAT reduction; increased competition Romanian Gas:…
Management agenda for 2016 Capitalize on existing foundation to deliver on strategic objectives, although impacted by adjustment to market downturn Focus on sustainable performance, profitability and optimization of assets portfolio…
OMV Petroms heritage: 150 years of Romanian oil history 1857 First officially reported oil production in Romania: 275 t 1975 First exploration drilling in the Black Sea 1861 First well manually drilled by means of wooden rods and gimlet…
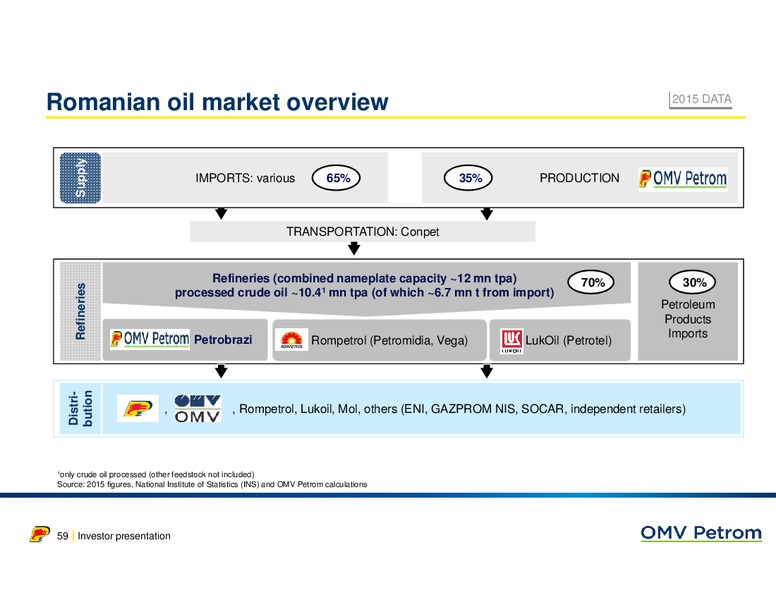
Romanian oil market overview 2015 DATA Supply IMPORTS: various 65% 35% PRODUCTION TRANSPORTATION: Conpet Refineries (combined nameplate capacity 12 mn tpa) 70% 30% Refineries processed crude oil 10.41 mn tpa (of which…
Downstream Oil market environment in 2015 Our operating region1 Romania Strong refining margins throughout Increased oil product demand vs 2014 2015, however on downward trend in Strong market competition Q4/15 Long on both diesel…
Romanian gas market overview 2015 DATA Regula- tory Regulatory Body Romanian Energy Regulatory Authority (ANRE) IMPORTS: various 2% 98% PRODUCTION: , Romgaz, Supply STORAGE: TRANSPORTATION: Transgaz Romgaz, Depomures,…
Romanian power market overview 2015 DATA Regulatory Regulatory Body Romanian Energy Regulatory Authority (ANRE) 94% 6% Coal Gas Nuclear Hydro Renewables Supply Production Imports 28% 15% 18% 26% 13% Transport &…
Romanian gas and power markets overview in 20151 Gas demand, TWh Power production, TWh 63.6 64.6 133 128 58.6 121 6.4 8.4 Renewables 20 10 1 4.7 Hydrocarbons Import Gas 6.8 7.0 6.8 1.2 2.7 2.6 CCPP Brazi Domestic Gas 11.7 11.6…
OMV Petrom Group fuel retail sales (mn l) 188 163 159 136 140 84 2011 12 13 14 2015 2,445 2,405 2,405 2,308 2,444 Republic of Romania Moldova Serbia 2011 12 13 14 2015 152 402 240 219 195 184 181 Bulgaria Black Sea…
 Loading...