SEVEN ENERGY Q3 RESULTS PRESENTATION 2015 30 November 2015
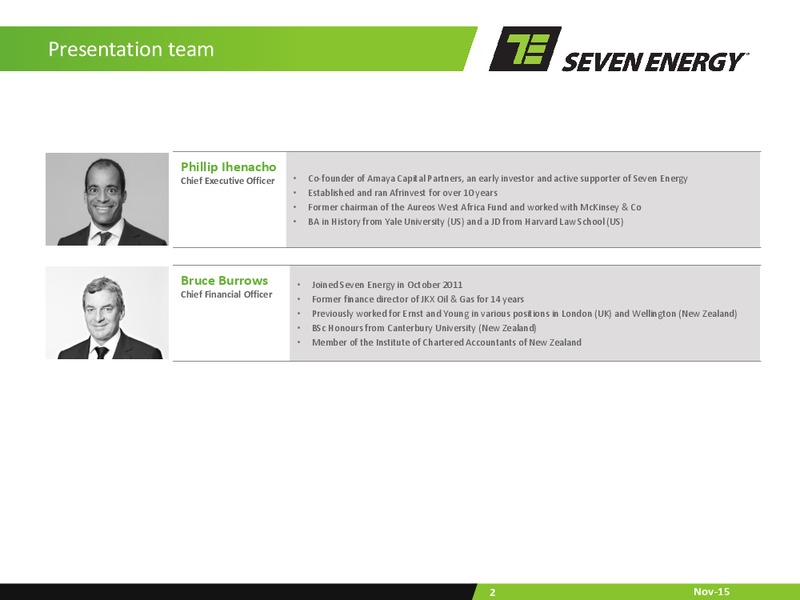
Presentation team Phillip Ihenacho Chief Executive Officer Co-founder of Amaya Capital Partners, an early investor and active supporter of Seven Energy Established and ran Afrinvest for over 10 years Former chairman of the Aureos…
FIRST NINE MONTHS 2015 HIGHLIGHTS 200 million MIGA 64 MMcfpd 58 mbopd expropriation coverage secured for Accugas gas deliveries Gross oil production Accugas up by 179% flat year-on-year World Bank support YTD Capex 171 52…
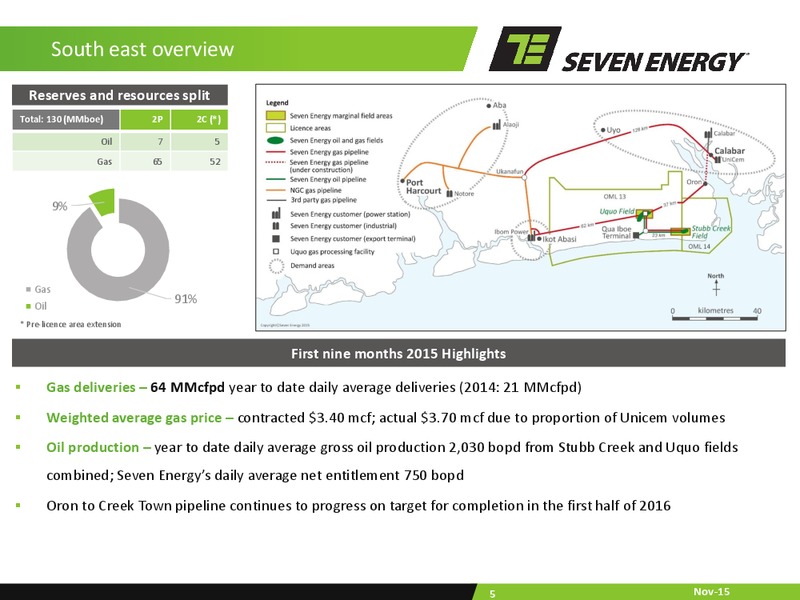
South east overview Reserves and resources split Total: 130 (MMboe) 2P 2C (*) Oil 7 5 Gas 65 52 9% Gas Oil 91% * Pre-licence area extension First nine months 2015 Highlights Gas deliveries 64 MMcfpd year to date…
North west overview Reserves and resources split Total: 222 (MMboe) 2P 2C Oil 68 50 Gas 80 24 53% Gas Oil 47% First nine months 2015 Highlights Production 55,700 bopd daily average gross production (2014: 58,000 bopd)…
Income statement million First nine First nine Increased gas sales revenue contributions months months 69% 31% Oil Gas 2015 2014 9M 2015 147 65 Revenue 212 241 Cost of sales 90% 10% - Production expenses (147) (153) - Increase in…
Balance sheet million 30 Audited September 31 December 2015 2014 Intangible assets 136 74 Property, plant and equipment 1,859 1,864 Capital expenditure reduced by 76% Other non-current assets 74 63 First nine months 2014 Non-current…
2015 funding plan Accugas facility Refinancing of the Accugas Project Finance and Acquisition Finance Facilities into a single combined facility Complete Accugas working capital facility Accugas Naira working capital facility (up…
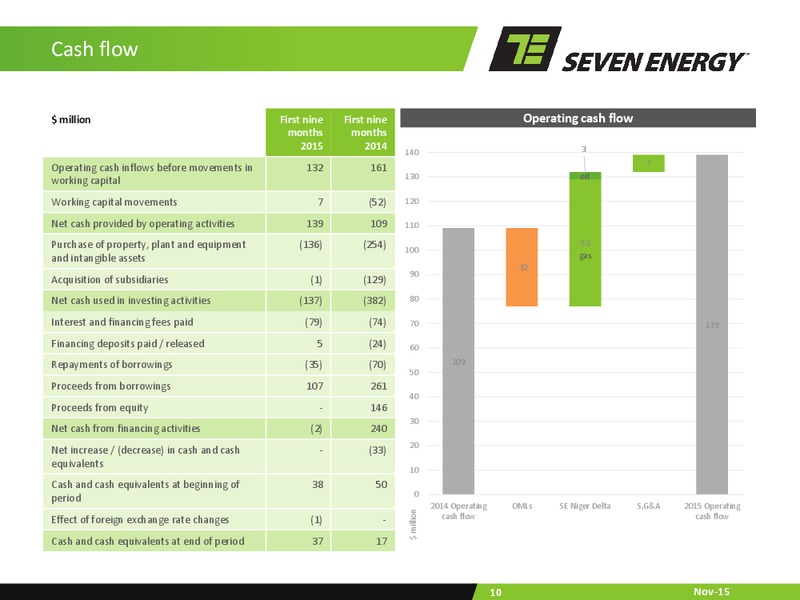
Cash flow million First nine First nine Operating cash flow months months 2015 2014 140 3 7 Operating cash inflows before movements in 132 161 130 oil working capital Working capital movements 7 (52) 120 Net cash provided by…
 Loading...