Bonanza Creek Overview Market Cap(1): 200 million Wattenberg Field(2) Arkansas 25,000 7,000 Enterprise Value(1): 1.3 billion Boe/d Boe/d 1Q16 Production: 24.3 Mboe/d Production Mix(3): 58% Oil 2015 Proved Reserves: 101…
Driving Efficiencies & Preserving the Balance Sheet Solid 1Q operational execution Assets continue to outperform expectations; third consecutive quarter exceeding guidance for production and costs Controlling costs to preserve…
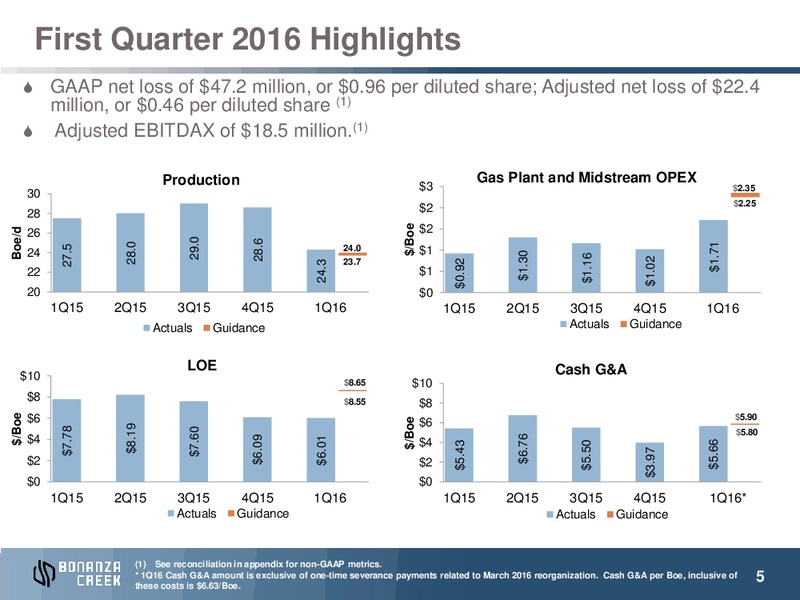
First Quarter 2016 Highlights GAAP net loss of 47.2 million, or 0.96 per diluted share; Adjusted net loss of 22.4 million, or 0.46 per diluted share (1) Adjusted EBITDAX of 18.5 million.(1) Production Gas Plant and Midstream OPEX 3…
First Quarter Wattenberg Program Company connected 11.3 net wells into sales; exited the quarter with 6 DUCs Company achieved 2.4 2.5 million SRL well costs during the first quarter Drilling program focused on areas with existing…
Increased Sand Continues to Outperform Extended Production History Confirms Performance Improvement 25% 24% Uplift at Uplift at day 560 day 480 22% Uplift at day 300 Upsized Frac Job 1,500 lbs per lateral ft Standard Frac…
Plug-and-Perf Completions Plug-and-perf ideal for mono- bore well design Potential 25% EUR Uplift Expected cost similar to sliding sleeves on multi-well pads Provides 1,920 entry points into the reservoir vs. 40 with sliding…
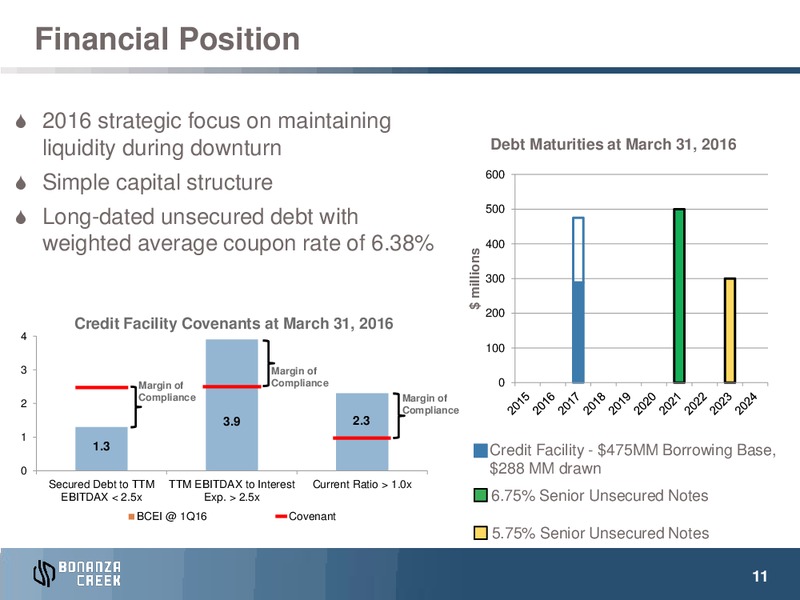
Financial Position 2016 strategic focus on maintaining liquidity during downturn Debt Maturities at March 31, 2016 600 Simple capital structure 500 Long-dated unsecured debt with weighted average coupon rate of 6.38% 400…
Derivative Position In 1Q16, the Company restructured its 2016 derivatives Sold 5.5 Mboe/d of 3-way collars Used proceeds from 3-way collars to purchase in-the-money puts and swaps Settlement Period Volume (Bbls/d) Contract Type…
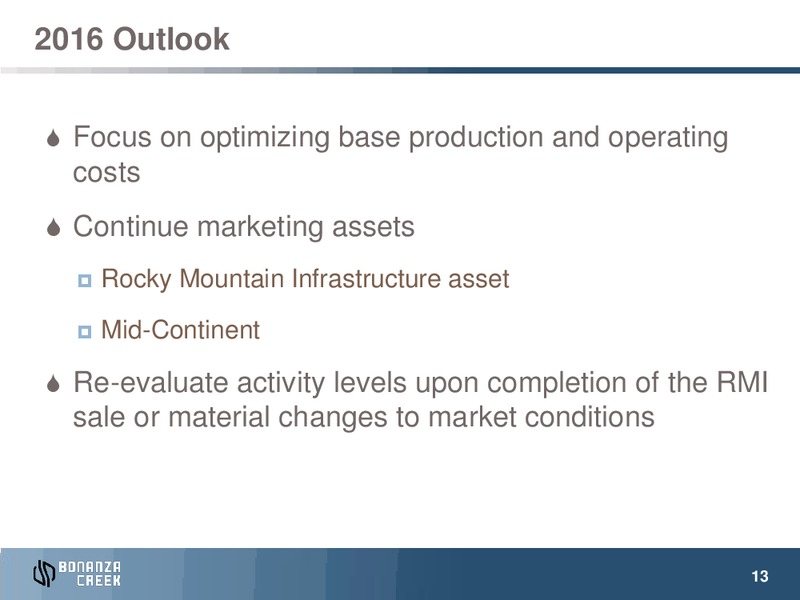
2016 Outlook Focus on optimizing base production and operating costs Continue marketing assets Rocky Mountain Infrastructure asset Mid-Continent Re-evaluate activity levels upon completion of the RMI sale or material changes to…
Adjusted Net Income (1) Reconciliation Three Months Ended March 31, 2016 Net Loss (47,237) Adjustments to net loss: Derivative gain 1,007 Derivative cash settlements 7,508 Income from termination fee (6,000) Impairment of proved…
Adjusted EBITDAX(1) Reconciliation Three Months Ended March 31, 2016 Net Loss (GAAP) (47,237) Exploration 266 Depreciation, depletion and amortization 26,379 Impairment of proved properties 10,000 Abandonment and impairment of…
Contiguous Position Enables Efficient Development Contiguous Leasehold Position Advantage on 97,000 Gross (70,000 Net) Acres Minimize rig movement time from pad to pad Leverage efficient batch drilling approach on multi-well pads…
Consistent Geology Throughout Acreage Position Niobrara A Bench 3 Thinner and resistivity less developed vs B & C Benches 22 Niobrara B Bench 1 4 Consistent thickness and resistivity across BCEI leasehold 5 Niobrara C Bench 6 7…
Significant Multi-Year Growth in the Wattenberg 2012 2015 2012 Niobrara B productive across acreage 2013 Niobrara C productive across acreage; Codell productive across 15,000 net acres 2014 Niobrara B / C stacking confirmed;…
DJ Basin Predictability is Superior 8x 7x Ideally suited for full-field 1st 90 Day Production: Ratio of P10/P90 6x development 5x 4x 3x 2x 1x 0x Permian - Wolfcamp Marcellus Eagle Ford Utica Bakken DJ…
Increased Gas Infrastructure Enhances Productivity Sullivan CS 40 MMcf/d Lucerne II 200 MMcf/d Windmill Line DCP Lucerne II plant brings significant additional gas processing capacity to the basin, creating lower, more…
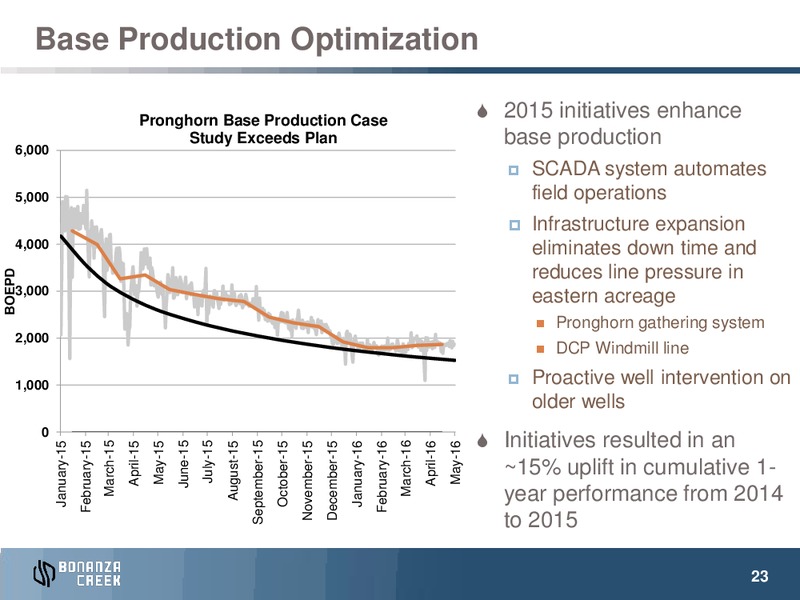
Base Production Optimization Pronghorn Base Production Case 2015 initiatives enhance 6,000 Study Exceeds Plan base production SCADA system automates 5,000 field operations Infrastructure expansion 4,000 eliminates down time and…
 Loading...