Q1 2016 Results Highlights Revenues of Ps 46.9 billion (+35.2%) Adj. EBITDA(1) reached Ps 12.5 billion (+22.4%) Operating Income was Ps 1.6 billion (-63.8%) Total Capex was Ps 14.7 billion (+19.4%) Crude oil production was…
Q1 2016 Results Expressed in US Dollars The devaluation of the local currency resulted in an immediate reduction of Revenues and Adj. EBITDA; Operating Income suffered additional effects of higher depreciation. Revenues (1) Adj.…
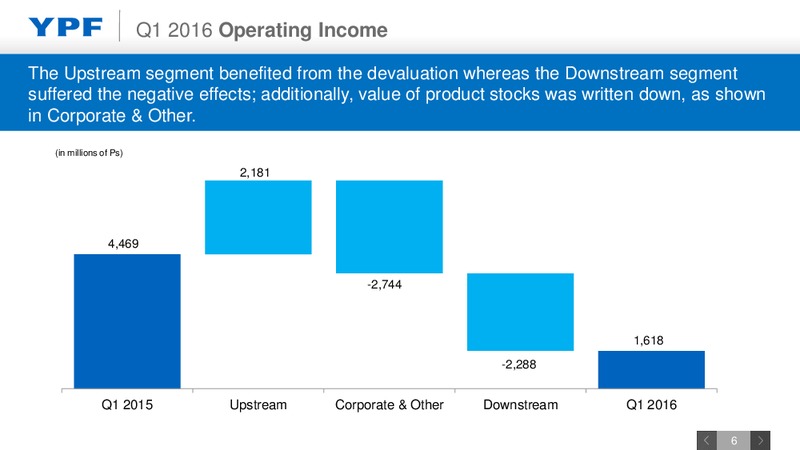
Q1 2016 Operating Income The Upstream segment benefited from the devaluation whereas the Downstream segment suffered the negative effects; additionally, value of product stocks was written down, as shown in Corporate & Other. (in…
Q1 2016 Operating Income Revenues were up in line with most of our cash costs; but higher depreciation on our dollar- based assets resulted in a 64% decline in Operating Income (in millions of Ps) 12,232 -5,792 4,469…
Q1 2016 Upstream Results Upstream Operating Income almost doubled as prices are dollar-denominated and the majority of our costs are in pesos. (In million of Ps) 10,755 92 -4,308 -2,545 4,441 -1,550 -263 2,260 Q1 2015…
Q1 2016 Upstream Results Production Total production was slightly above last years, with 0.8% growth in crude oil and 1.1% growth in natural gas production. Crude oil production Natural gas production Total production (Kbbl/d)…
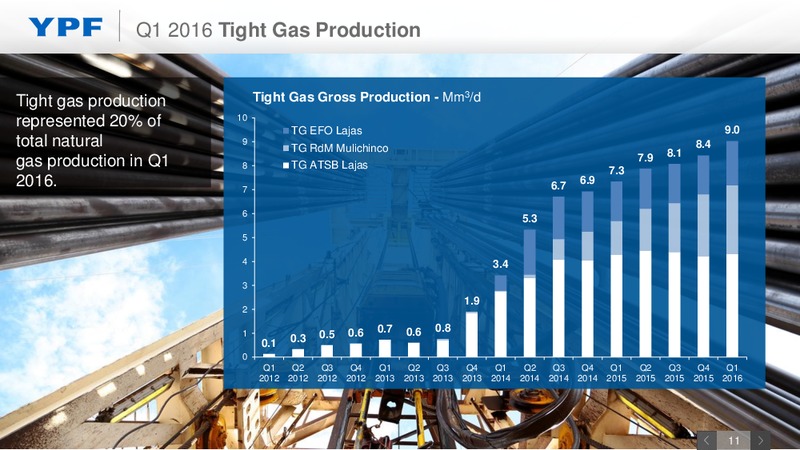
Q1 2016 Tight Gas Production Tight gas production Tight Gas Gross Production - Mm3/d represented 20% of 10 TG EFO Lajas 9.0 total natural 9 TG RdM Mulichinco 8.4 7.9 8.1 gas production in Q1 8 TG ATSB Lajas 7.3 2016. 7 6.7 6.9 6 5.3 5…
Q1 2016 Downstream Results Downstream Operating Income declined 53% as higher crude oil prices, driven by peso devaluation, resulted in an increase in Purchases that fully offsets Revenue increase. (in millions of Ps) 9,055…
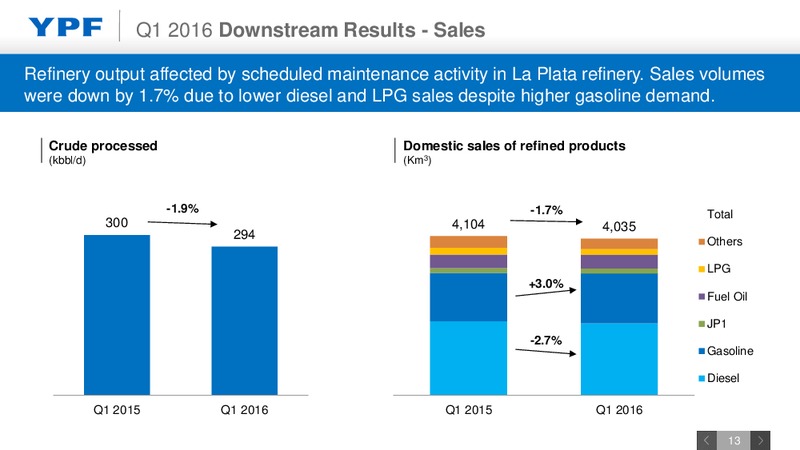
Q1 2016 Downstream Results - Sales Refinery output affected by scheduled maintenance activity in La Plata refinery. Sales volumes were down by 1.7% due to lower diesel and LPG sales despite higher gasoline demand. Crude processed…
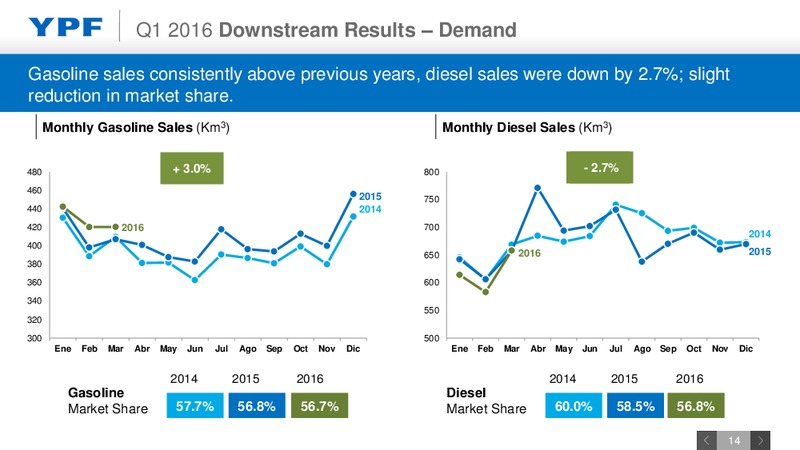
Q1 2016 Downstream Results Demand Gasoline sales consistently above previous years, diesel sales were down by 2.7%; slight reduction in market share. Monthly Gasoline Sales (Km3) Monthly Diesel Sales (Km3) 480 + 3.0% 800 +-0.8% 2.7%…
Q1 2016 Capex Capex in line with guidance of 25% reduction in dollar terms. Upstream (in millions of Ps) Downstream Upstream Activity breakdown: 66% in drilling, 15% in facilities, 11% in workovers and 8% in Others +19.4%…
Q1 2016 Cash Flow From Operations Strong cash position at the end of Q1 2015 despite currency devaluation. Operating Cash Flow was down due to working capital build-ups. Consolidated statement of cash flows Cash flow from…
Q1 2016 Financial Situation Update(1) Cash position covers debt maturities for the rest of the year. Leverage ratio in line with target. Financial debt amortization schedule (1) (2) (in millions of USD) 2,965 Debt profile…
Q1 2016 Summary Quarter negatively affected by currency devaluation; partial pass through to prices to continue in following quarters Focused on cost reduction and efficiencies Difficult operating environment in the Downstream…
 Loading...