SEVEN ENERGY FIRST QUARTER RESULTS PRESENTATION 2016 25 May 2016
Presentation team Phillip Ihenacho Chief Executive Officer Co-founder of Amaya Capital Partners, an early investor and active supporter of Seven Energy Established and ran Afrinvest for over 10 years Former chairman of the Aureos…
Introduction Near term macroeconomic challenges Weakened oil price Naira / Dollar convertibility Gas customer demand build up slower than anticipated Restrained international capital markets Prolonged shutdown of Forcados…
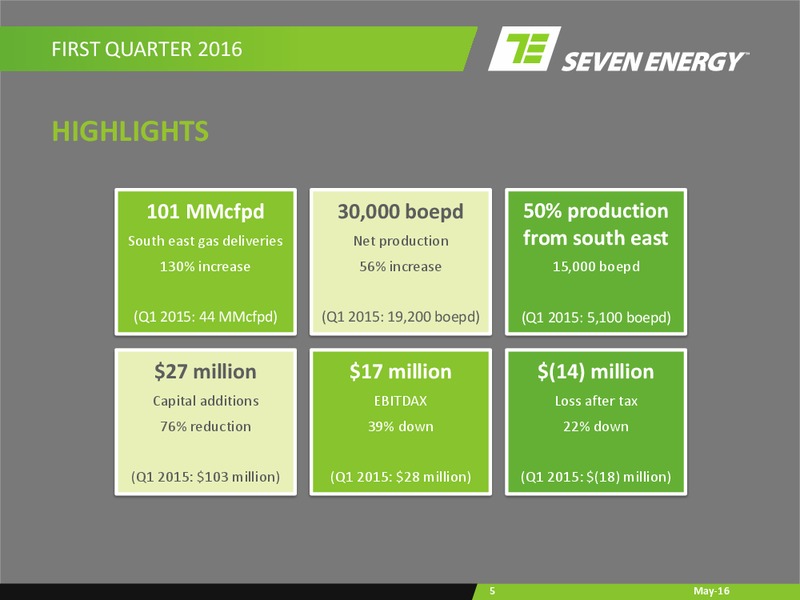
FIRST QUARTER 2016 HIGHLIGHTS 101 MMcfpd 30,000 boepd 50% production South east gas deliveries Net production from south east 130% increase 56% increase 15,000 boepd (Q1 2015: 44 MMcfpd) (Q1 2015: 19,200 boepd) (Q1 2015: 5,100…
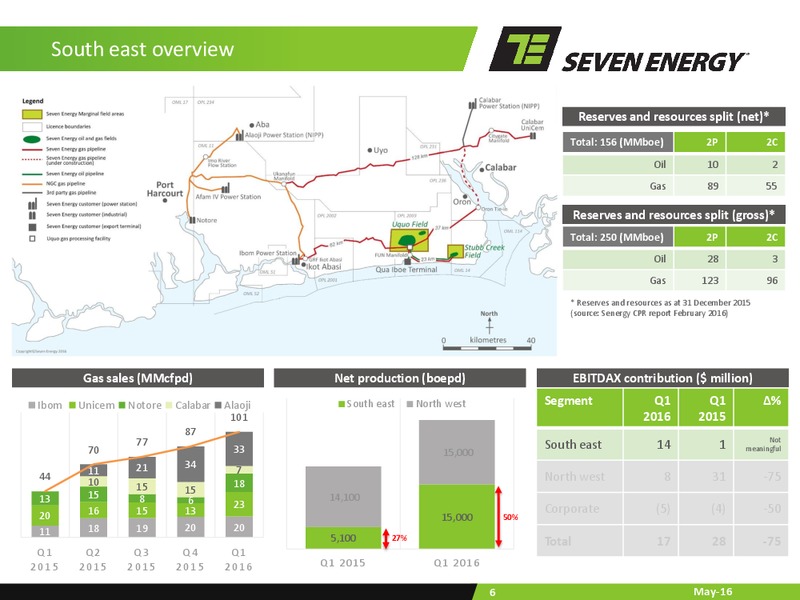
South east overview Reserves and resources split (net)* Total: 156 (MMboe) 2P 2C Oil 10 2 Gas 89 55 Reserves and resources split (gross)* Total: 250 (MMboe) 2P 2C Oil 28 3 Gas 123 96 * Reserves and resources as at 31…
North west overview Reserves and resources split* Total: 231 (MMboe) 2P 2C Oil 72 57 Gas 81 21 53% Gas Oil 47% * Reserves and resources as at 31 December 2015 (source: Senergy CPR report February 2016) Q1 2016 Highlights…
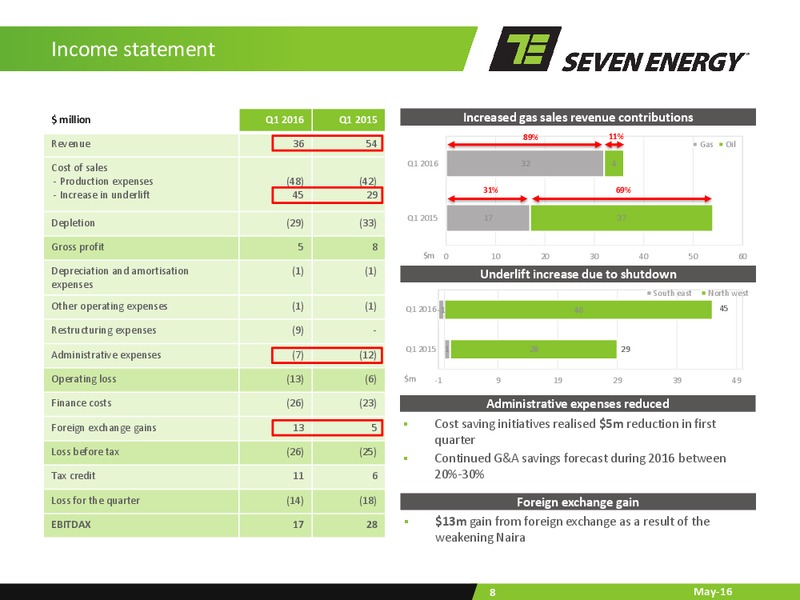
Income statement million Q1 2016 Q1 2015 Increased gas sales revenue contributions 89% 11% Revenue 36 54 Gas Oil Q1 2016 32 4 Cost of sales - Production expenses (48) (42) 31% 69% - Increase in underlift 45 29 Q1 2015 17 37…
Cash flow million Q1 2016 Q1 2015 Reduction in cash from operations Net cash provided by operating activities 35 54 Period-on-period reduction of 40 million due to no Net purchase of property, plant and (63) (39) liftings from OMLs…
Balance sheet million 31 March 31 December Capital expenditure reduced by 74% 2016 2015 (audited) First quarter 2015 Intangible assets 105 105 Midstream Property, plant and equipment 1,723 1,725 7mn Other non-current assets 70 67…
2016 Capital Structure Initiatives Seven Energy faces macro challenges in the near term Naira / Dollar convertibility Weakened oil price Gas customer demand build up slower than anticipated Restrained international capital markets…
2016 key initiatives Complete construction of Oron to Creek Town gas pipeline to integrate our midstream infrastructure Increase gas deliveries as customer demand builds to 150 MMcfpd by year end Conclude Partial Risk Guarantee for…
 Loading...