FY2015 IFRS FINANCIAL AND OPERATING RESULTS March 2, 2016, Saint-Petersburg
Agenda Highlights, Alexey Yankevich Financials Member of the Management Board, CFO Upstream Alexander Mikheev Head of Economics and Investment Department, Exploration and Production Division Downstream Vladimir Konstantinov…
Exploration and Production Hydrocarbon production volumes continue to rise as focus remains on cost management and efficiency Gazprom Neft 5
Key exploration and production results Hydrocarbon production rose by 20% y-o-y Maintained production levels at mature fields Reached planned production levels for 2015 at major projects: Novy Port 0.35 MMToe Prirazlomnoye 0.87…
High reserves replacement ratio due to acquisitions and organic growth despite lower crude price Change in PRMS (SPE) proved reserves*, Reserves revisions, MMToe MMToe 196% reserves replacement ratio *Data does not include NIS…
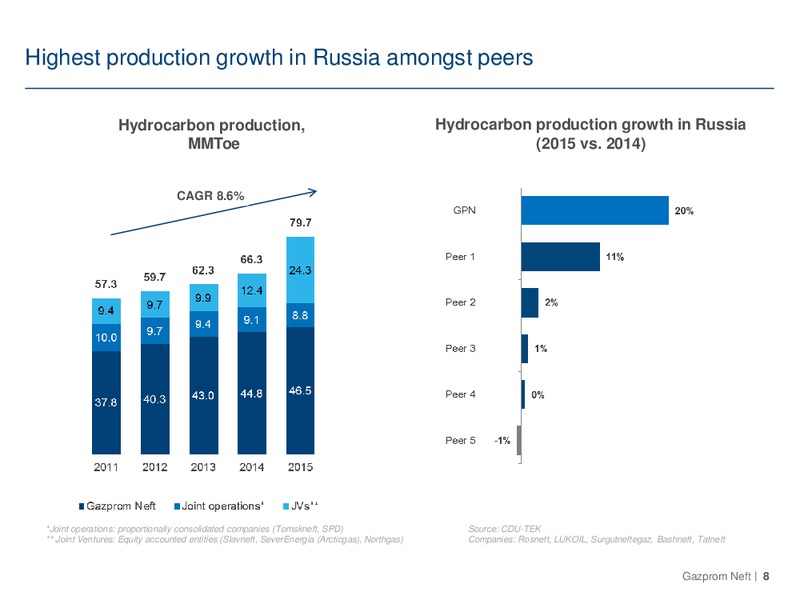
Highest production growth in Russia amongst peers Hydrocarbon production, Hydrocarbon production growth in Russia MMToe (2015 vs. 2014) CAGR 8.6% *Joint operations: proportionally consolidated companies (Tomskneft, SPD) Source:…
Successful implementation of key projects and acquisitions drives hydrocarbon production growth Hydrocarbon production: 2015 vs. 2014, MMToe 20.3% Liquid hydrocarbons +3.61 MMTonnes Gas +9.83 MMToe *JVs refer to…
Controlling OPEX despite reserves depletion, higher watercut and inflationary pressures +6% +1% 1,582 1,472 1,492 REVEX +13% Lifting costs +4% Note: The chart above takes into account the following projects: NNG, MN,…
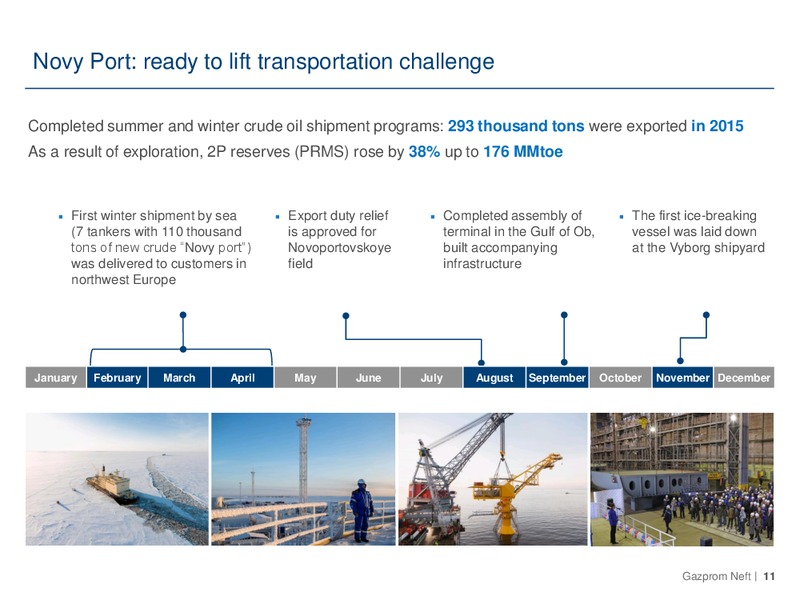
Novy Port: ready to lift transportation challenge Completed summer and winter crude oil shipment programs: 293 thousand tons were exported in 2015 As a result of exploration, 2P reserves (PRMS) rose by 38% up to 176 MMtoe First…
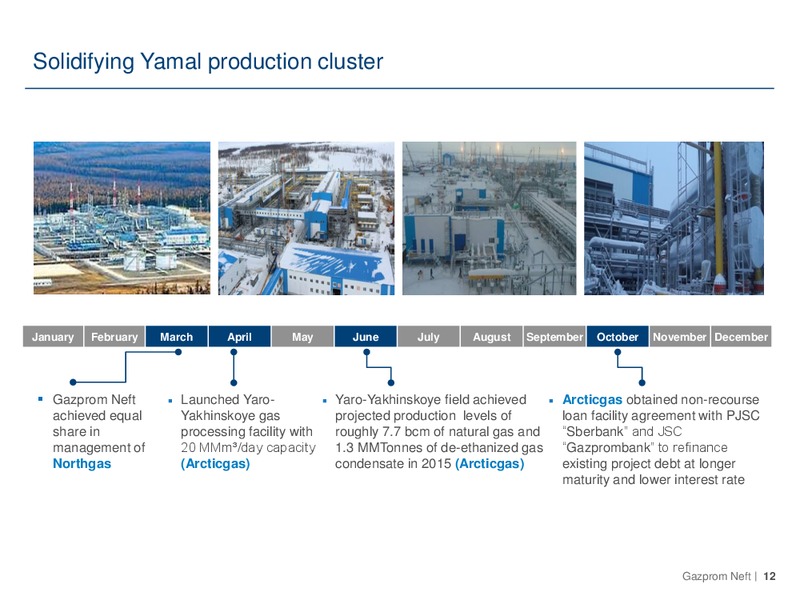
Solidifying Yamal production cluster January February March April May June July August September October November December Gazprom Neft Launched Yaro- Yaro-Yakhinskoye field achieved Arcticgas obtained non-recourse achieved…
New project developments Prirazlomnoye Messoyakha Badra Kurdistan (Iraq) Approved technological scheme Built 71km of trunk pipeline, Completed three production Began commercial production for field development assembled…
Downstream Strategic investments result in higher product quality and rising market share Gazprom Neft 14
Crude and product mix reflects shifting regulatory and price environment Crude price and average netbacks, /bbl Crude mix, MMTonnes Brent Crude export Crude to CIS & Russia Refining netback Crude export netback…
Refining highlights: 2015 Omsk: Increased condensate processing to 1.4 MMTonnes (+0.8 MMTonnes vs. 2014) Began developing Gazprom Neft catalyst production project Introduced new oil products: MTBE, light gasoil for bunkering,…
Retail sales increase amidst market challenges Retail achievements in 2015: Retail sales in 2015: Russia 8.1 MMTonnes +1% Y-o-Y International 2.1 MMTonnes +7% Y-o-Y Throughput per station in Russia stood at 19.1 tpd Acquired 11…
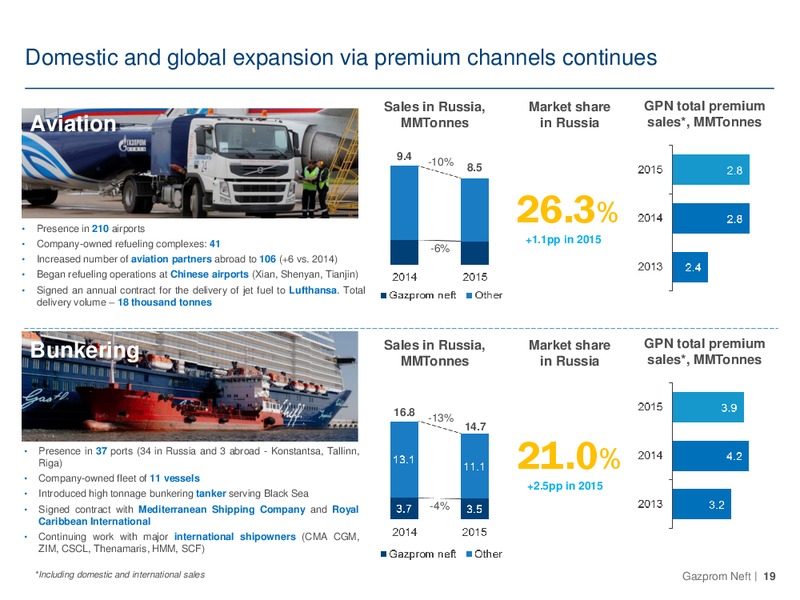
Domestic and global expansion via premium channels continues Sales in Russia, Market share GPN total premium Aviation MMTonnes in Russia sales*, MMTonnes 9.4 -10% 8.5 Presence in 210 airports 26.3% Company-owned refueling…
Premium channel growth continues, at home and abroad Sales in Russia, Market share GPN total premium Lubricants MTonnes in Russia sales*, MTonnes 775 -5% 736 Opened 13 branded G-Energy service stations (5 in Russia, 3 in 17.1…
Financials Strategic focus in challenging macroeconomic environment Gazprom Neft 21
Macro environment and duty lag negatively affected 4Q Sales decreased y-o-y by 2.1% due to 1,691 1,656 declining global oil and oil products prices Sales partially offset by increase of volumes and realization prices at domestic…
EBITDA reconciliation FY2015 vs. FY2014 EBITDA Y2015 vs. Y2014, RUB bln Group share in JVs EBITDA External factors = 12,4 Internal factors = 49,8 2014 2015 Gazprom Neft 23
EBITDA reconciliation 4Q15 vs. 3Q15 EBITDA 4Q15 vs. 3Q15, RUB bln Group share in JVs EBITDA Gazprom Neft 24
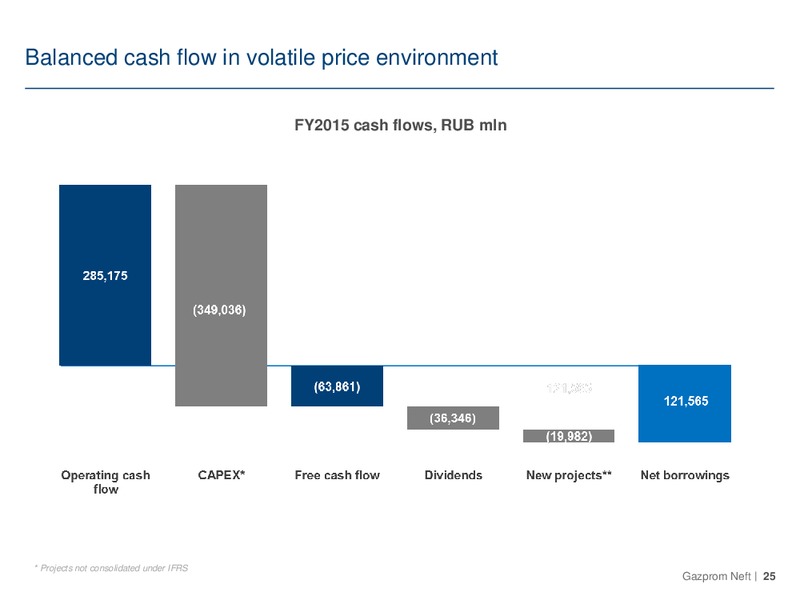
Balanced cash flow in volatile price environment FY2015 cash flows, RUB mln * Projects not consolidated under IFRS Gazprom Neft 25
Upstream capex growth driven by increased brownfield activities, greenfield development Investments, RUB mln 29% Y-o-Y increase in IFRS capex 2% Y-o-Y lower brownfield capex (adjusted for Priobskoye field to brownfield…
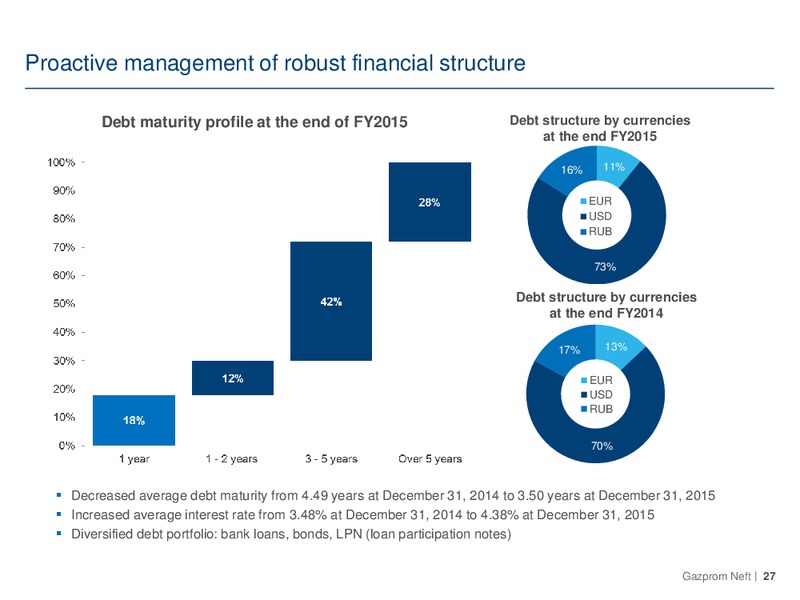
Proactive management of robust financial structure Debt maturity profile at the end of FY2015 Debt structure by currencies at the end FY2015 16% 11% EUR USD RUB LPN 73% Debt structure by currencies at the end FY2014 17%…
 Loading...