1Q2016 IFRS FINANCIAL AND OPERATING RESULTS May 31, 2016, Saint-Petersburg
Agenda Highlights, Alexey Yankevich Financials Member of the Management Board, CFO Upstream Alexander Mikheev Head of Economics and Investment Department, Exploration and Production Division Downstream Vladimir Konstantinov…
Highlights 1Q2016 Financial Performance: Sales: RUB 366 bln (-3.7% Y-o-Y) EBITDA*: RUB 96 bln (+3.2% Y-o-Y) Net Income: RUB 42 bln (+6.2% Y-o-Y) Operational Progress in 1Q2016: Hydrocarbon production up 14.8% MMToe Y-o-Y, (15.1%…
Exploration and Production Technology strategy driving production efficiency and new resource development Gazprom Neft 5
Key upstream events Commercial production began at Novoportovskoye field following official launch (25 May, 2016) Launched two Arc-7 class tankers for year- round crude exports from Novy port First shipment of crude via Arctic…
Strong y-o-y production growth and consistent q-o-q growth for fully-owned assets Average daily hydrocarbon production, 000 toe/day Hydrocarbon production, MMtoe 14.8% 227,6 227,6 225,5 20,7 20,9 20,9 19,8 217,3 18,2 6,7 6,8…
Significant rises in crude production at Novoport and Prirazlomnoye and gas production at Yamal Hydrocarbon production: 1Q2016 vs. 1Q2015, MMtoe 14.8% 0.01 0.07 (0.02) 20.94 0.01 0.73 0.91 0.24 0.03 0.00 0.29 0.10 18.24…
Marginal increase in lifting costs and OPEX-growth constrained despite reserves depletion Brownfield OPEX Indicators 1Q 2016 vs. 1Q 2015, RUB/toe +9% +2% 35 12 89 2 23 Lifting costs up 4% 375 REVEX 286 286 Lifting…
Novy Port: began year-round crude exports May 25, 2016 marked the official launch of A key outpost in the development of the year- round crude exports at Northern Sea Route and Arctic exploration Novoportovskoye field Arctic Gates the…
New project developments continuing, domestically and internationally Prirazlomnoye Messoyakha Badra Kurdistan (Iraq) Executed program for the Began construction Produced 2 MMtonnes of Gazprom Neft received construction of well…
Drilling Support Center (DSC) launch enabling an increasing number of high-technology wells Horizontal drilling efficiency rate +22% +10 tonnes/day 90 % 87% Increase in drilling rate efficiency Increase in average production…
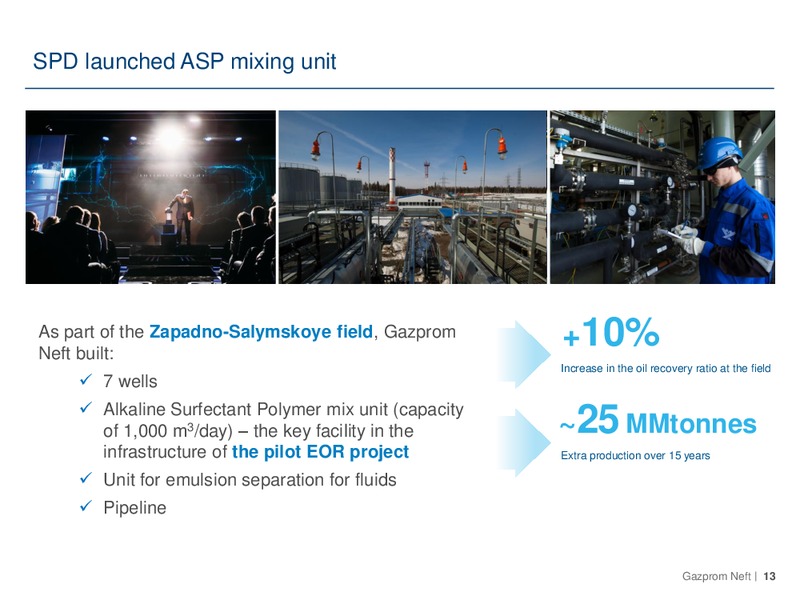
SPD launched ASP mixing unit As part of the Zapadno-Salymskoye field, Gazprom Neft built: +10% Increase in the oil recovery ratio at the field 7 wells Alkaline Surfectant Polymer mix unit (capacity of 1,000 m3/day) the key…
Downstream Strategic investments result in higher product quality and rising market share Gazprom Neft 14
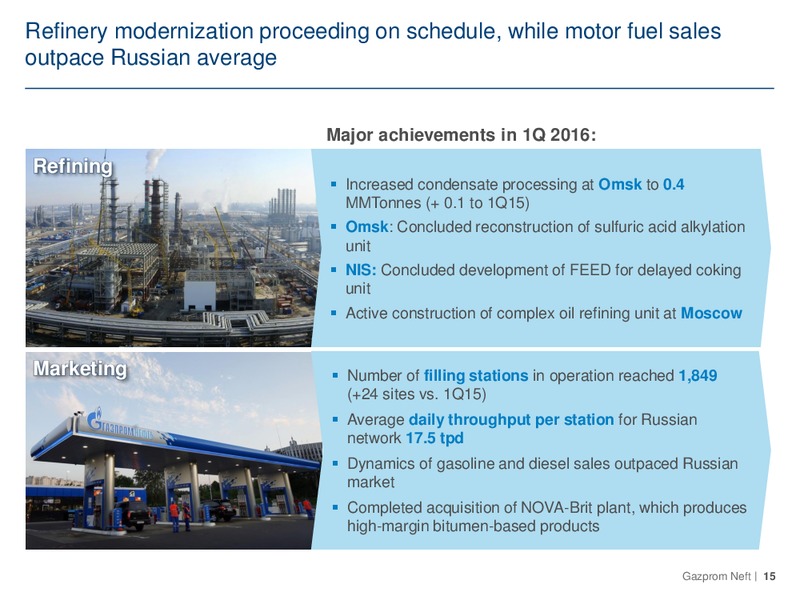
Refinery modernization proceeding on schedule, while motor fuel sales outpace Russian average Major achievements in 1Q 2016: Refining Increased condensate processing at Omsk to 0.4 MMTonnes (+ 0.1 to 1Q15) Omsk: Concluded…
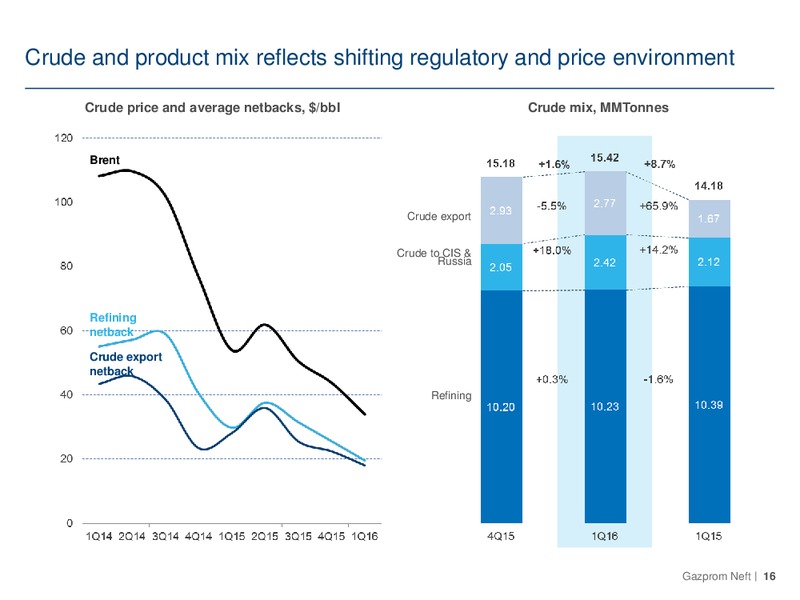
Crude and product mix reflects shifting regulatory and price environment Crude price and average netbacks, /bbl Crude mix, MMTonnes Brent Crude export Crude to CIS & Russia Refining netback Crude export netback…
1Q16 sales largely steady, outpacing Russian average Premium sales, MMTonnes Retail gasoline sales, MMTonnes Russia - 1.5% 1Q16 vs. 1Q15 -9.5% -0.5% -0.8% -16.7% Gazprom Neft Lubricants +13.4% -22.3% -22.4% Bunkering…
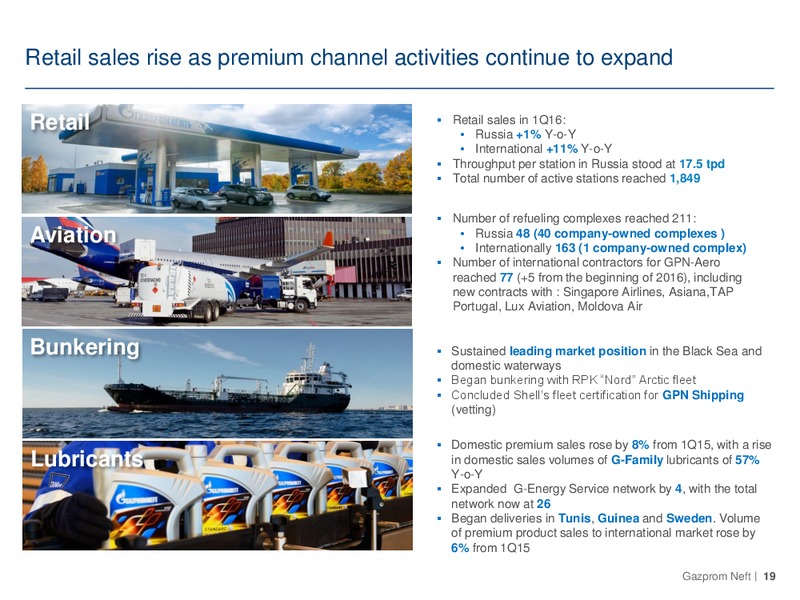
Retail sales rise as premium channel activities continue to expand Retail sales in 1Q16: Retail Russia +1% Y-o-Y International +11% Y-o-Y Throughput per station in Russia stood at 17.5 tpd Total number of active stations reached…
Financials Strategic focus and targeted management actions helped drive increase in EBITDA Gazprom Neft 20
Commercial and operational improvements and increased hydrocarbon production had a positive effect on EBITDA Sales fell by 3.7% y-o-y, driven by the decline in global crude and oil product price, but was partially offset by increased…
EBITDA reconciliation 1Q 2016 vs. 1Q 2015 EBITDA 1Q 2016 vs. 1Q 2015, RUB bln Group share in JVs EBITDA External factors = (7.3) Internal factors = 10.5 Gazprom Neft 22
EBITDA reconciliation 1Q 2016 vs. 4Q 2015 EBITDA 1Q 2016 vs. 4Q 2015, RUB bln Group share in JVs EBITDA External factors = (11.7) Internal factors = 15.5 Gazprom Neft 23
Balanced cash flow in volatile price environment 1Q 2016 cash flows, RUB mln 114,198 87,825 Bank deposits * Including changes in advances & inventory ** Projects not consolidated under IFRS Gazprom Neft 24
Upstream capex growth driven by stronger focus on brownfields, increasing greenfield development Investments, RUB mln 20% Y-o-Y increase in IFRS capex 4% Y-o-Y higher brownfield capex Greenfield capex rose by 9% Y-o-Y on active…
Proactive management of robust financial structure Debt maturity profile at the end of 1Q2016 Debt structure by instruments at the end 1Q2016 733,158 Other 97,317 87,825 55,842 Bonds Cash and cash equivalents 9,492 Short-term…
 Loading...