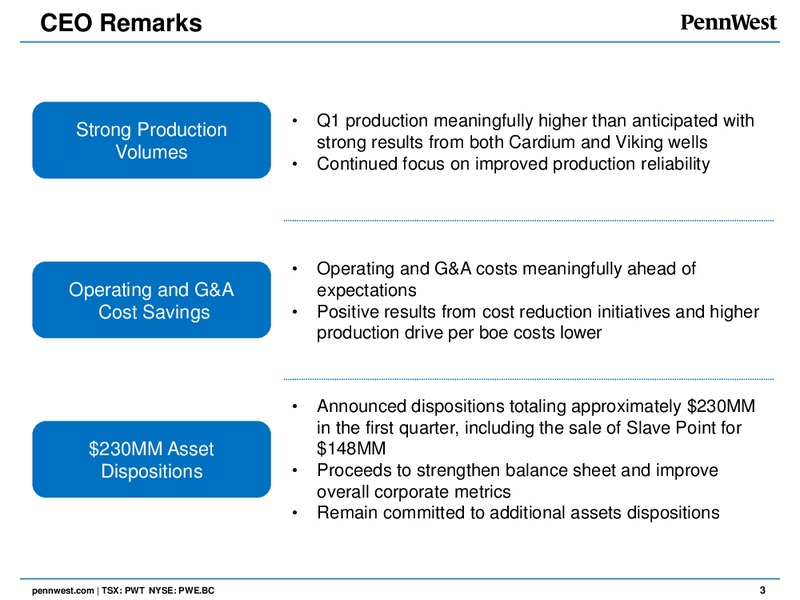
CEO Remarks Q1 production meaningfully higher than anticipated with Strong Production strong results from both Cardium and Viking wells Volumes Continued focus on improved production reliability Operating and G&A costs…
Senior Debt Compliance We were in compliance with all our financial covenants at March 31, 2016, including the Senior Debt to EBITDA covenant that was 4.4 times, relative to a 5.0 times limit We paid normal course senior note…
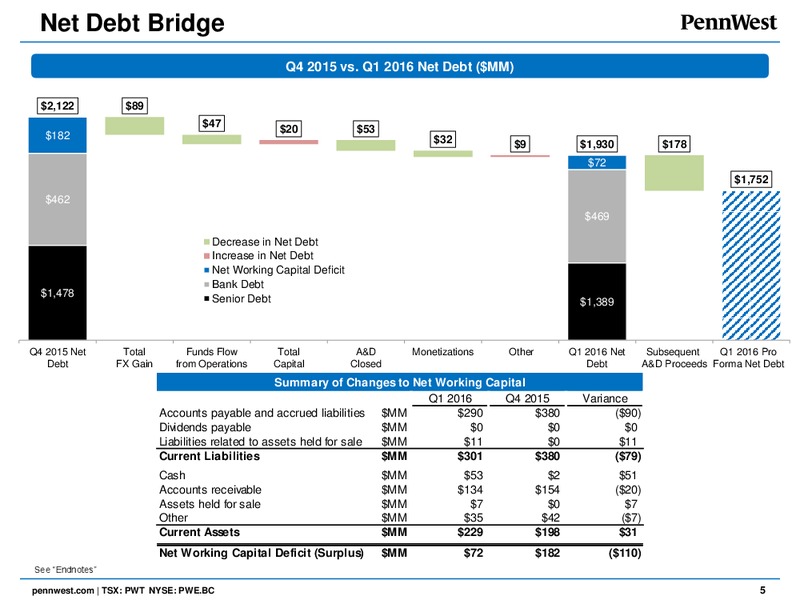
Net Debt Bridge Q4 2015 vs. Q1 2016 Net Debt (MM) 2,122 89 47 20 53 182 32 9 1,930 178 72 1,752 462 469 Decrease in Net Debt Increase in Net Debt Net Working Capital Deficit Bank Debt 1,478 Senior Debt 1,389 Q4 2015 Net…
Q1 2016 Funds Flow From Operations Bridge Funds Flow from Operations of 47MM was higher than the fourth quarter mainly due to operating and G&A cost savings Net Revenue was lower as a result of the weaker commodity price…
2016 Capital Budget & Guidance Operating Expense guidance has been lowered to 17.00 - 18.00/boe from 18.00 - 18.75/boe Annual average production guidance remains unchanged despite dispositions announced year to date 2016 FY…
Operated Development Activity Activity limited to completing and bringing on production from previously drilled wells Viking and Cardium Brought on production 21 wells in Viking and 5 wells in Cardium Showing strong production…
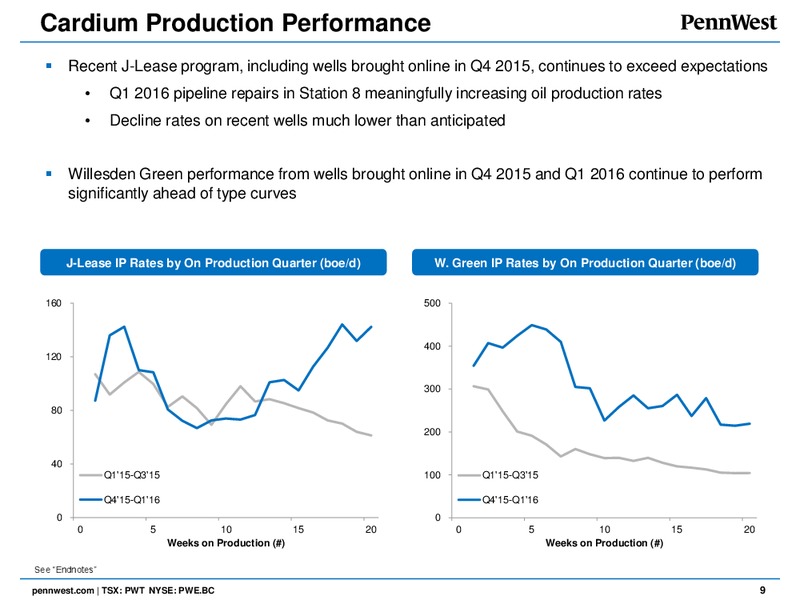
Cardium Production Performance Recent J-Lease program, including wells brought online in Q4 2015, continues to exceed expectations Q1 2016 pipeline repairs in Station 8 meaningfully increasing oil production rates Decline rates on…
Driving Down Operating Costs 650 Absolute operating costs at our existing properties reduced over 20%, which excludes the impact of divestitures 550 Operating Costs (MM) 450 Expect further 20% operating cost savings in…
 Loading...