Our Business Platforms Refining - Largest and Most Complex(1) in Niche Hawaii Market Crude capacity of 94,000 barrels per day 50% distillate yield configuration Flexibility to utilize a wide range of crude blends Logistics -…
Company Timeline 9/1/2012: 6/17/2013: 11/14/2013: 9/22/2015: 12/17/2015: Predecessor Agreed to Retail entered Laramie Energy Completed company purchase into a credit entered into a refinancing of emerges from Kapolei Refinery…
Growth Opportunity Framework Tier 1 Refining Marketing Midstream & downstream logistics Strategic Tier 2 Factors E&P with Laramie tie-in Existing Upstream logistics Competencies Gathering systems Gas processing NOL Chemical /…
Business Platform Overview
Hawaii Refinery Overview Asset Highlights Largest and most complex refinery in Hawaii Nelson complexity of 5.7 High-margin distillate yield configured for island demand Asset location and configuration favorably positioned to…
Logistics Overview Asset Highlights Hawaiian Assets Map (1) North America Integrated system enhances flexibility and profitability 30,000 Bbls Difficult to replicate asset base Multiple advantages from Single Point Mooring Latin…
Retail Overview Asset Highlights Extensive footprint across five islands Mid Pac acquisition significantly expanded scale and operating capabilities Anticipated continued volume growth from increasing retail and distribution…
Well Positioned to Benefit from Commodity Flows Waterborne Access Mid-Pacific Trends Located at the crossroads of changing crude flows Increased supply of cost-advantaged crude leads to from West to East sustainable competitive…
Leader in Niche Hawaiian Market Refined Product Demand(1) Par Refinery Yield MBbl/d Total Production 2015 Mar YTD 2016 80 Total Demand 72 72 Fuel oils Fuel oils 64 60 59 23% 23% 56 50 48 Other Other 44% 6% products Distillate…
Laramie Energy Overview Asset Highlights Keys To Long Term Value Realization Experienced management team in the basin with a 99% success rate Vast majority of 126,000 net acre position is held by production Drilling and completion…
Laramie Energy 2016 Development Program 2016 Plan Summary Acquisition Integration Strategy Backlog of 58 uncompleted wells as of March 31, 2016 Lower LOEs to Laramie historical levels Acquired properties average 0.73/Mcfe during 2015…
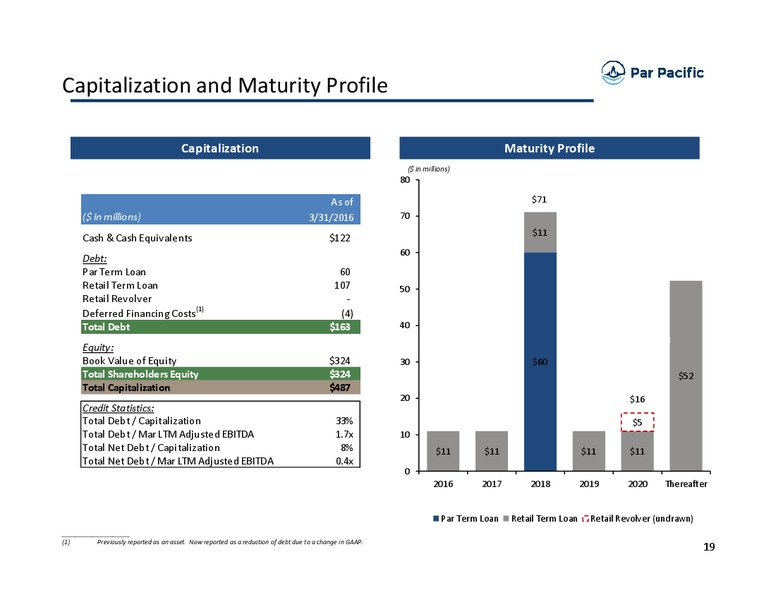
Capitalization and Maturity Profile Capitalization Maturity Profile ( in millions) 80 As of 71 ( in millions) 3/31/2016 70 11 Cash & Cash Equivalents 122 60 Debt: Par Term Loan 60 Retail Term Loan 107 50 Retail Revolver -…
Net Operating Loss Carryforward Selected Benefits Illustrative Value to Par(1) ( in millions) Differentiated Asset Relative to Peers Discount Rate 8.0% 10.0% 12.0% Potential to Enhance Annual Pre-Tax Earnings Cash Flow…
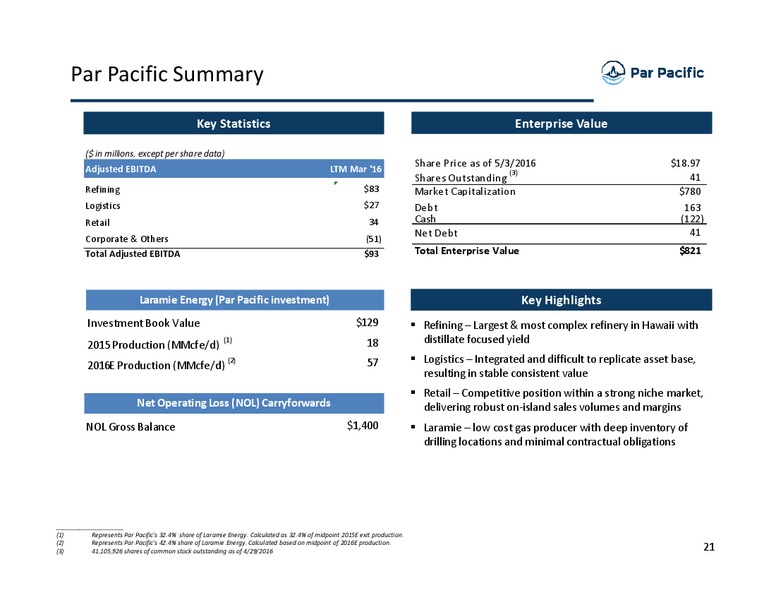
Par Pacific Summary Key Statistics Enterprise Value ( in millions, except per share data) Adjusted EBITDA LTM Mar '16 Share Price as of 5/3/2016 18.97 (3) Shares Outstanding 41 Refining 83 Market Capitalization 780 Logistics 27…
Summary High Quality Asset Base in Niche Market Identified Constructive Growth Market Opportunities Environment Significant Experienced Financial Management Flexibility Team and Board 22
Contact Information Par Pacific Holdings, Inc. Christine Thorp (NYSE MKT: PARR) Director, Investor Relations 800 Gessner Road, Suite 875 cthorpparpacific.com Houston, TX 77024 (832) 916-3396 (281) 899-4800 www.parpacific.com…
Appendix
Capitalization Detail ( in millions) Amount Outstanding Facility Borrower (3/31/2016) Undrawn Amount Amortization Maturity Interest Rate Term Loan Par 60.1 - NA 7/11/2018 10.00% (12.00% PIK) KeyBank Term Loan Retail 107.3 -…
Non-GAAP Financials Adjusted EBITDA Reconciliation and Cash Flow Data (1) (in thousands) 2014 2015 2016 Q1 Q2 Q3 Q4 Q1 Q2 Q3 Q4 Q1 Net income (loss) (14,568) (24,677) (39,456) 31,660 462 11,723 14,740 (66,836) (18,673)…
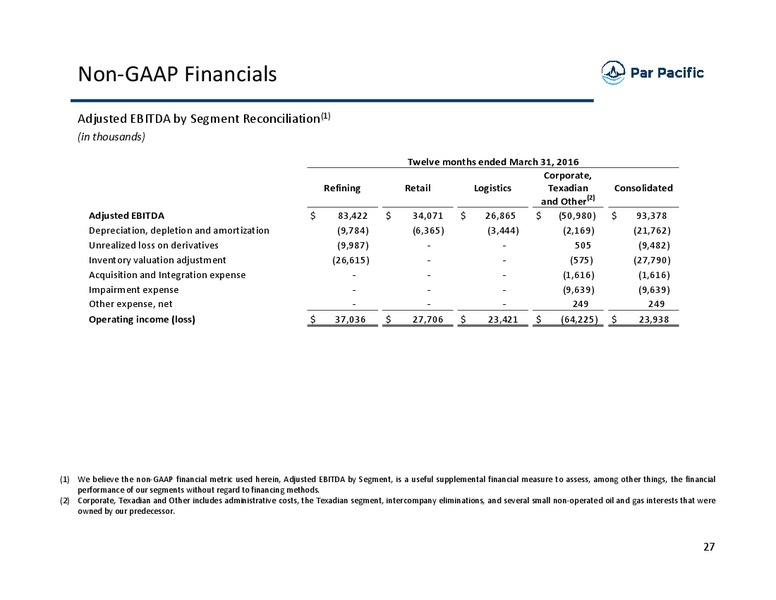
Non-GAAP Financials Adjusted EBITDA by Segment Reconciliation(1) (in thousands) Twelve months ended March 31, 2016 Corporate, Refining Retail Logistics Texadian Consolidated and Other(2) Adjusted EBITDA 83,422 34,071 26,865…
 Loading...