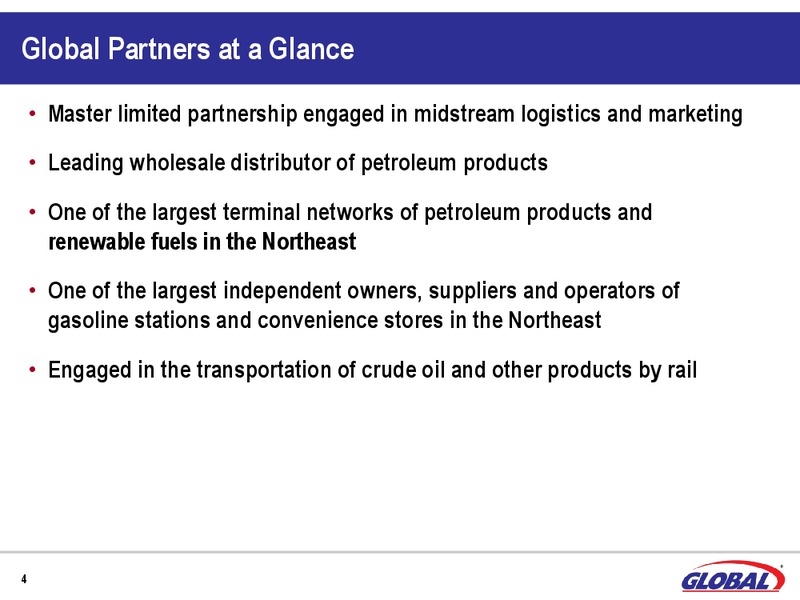
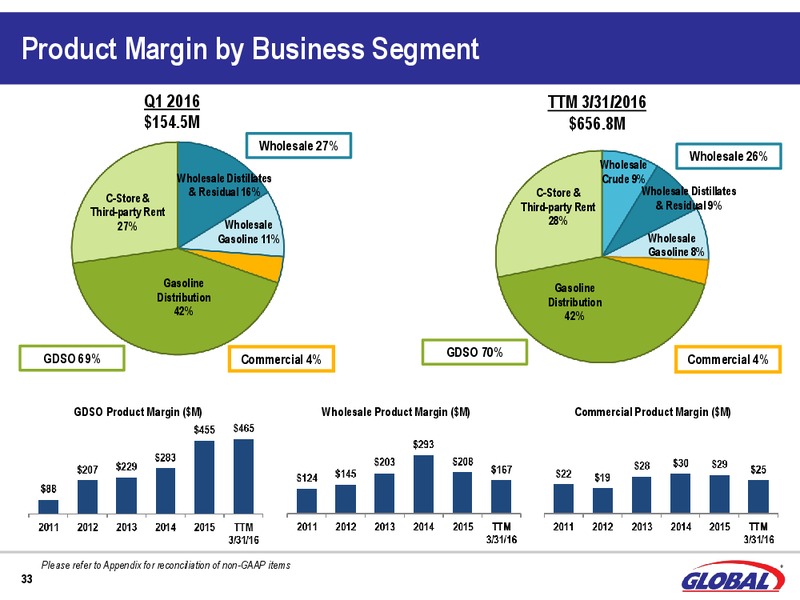
Global Partners at a Glance Master limited partnership engaged in midstream logistics and marketing Leading wholesale distributor of petroleum products One of the largest terminal networks of petroleum products and renewable fuels…
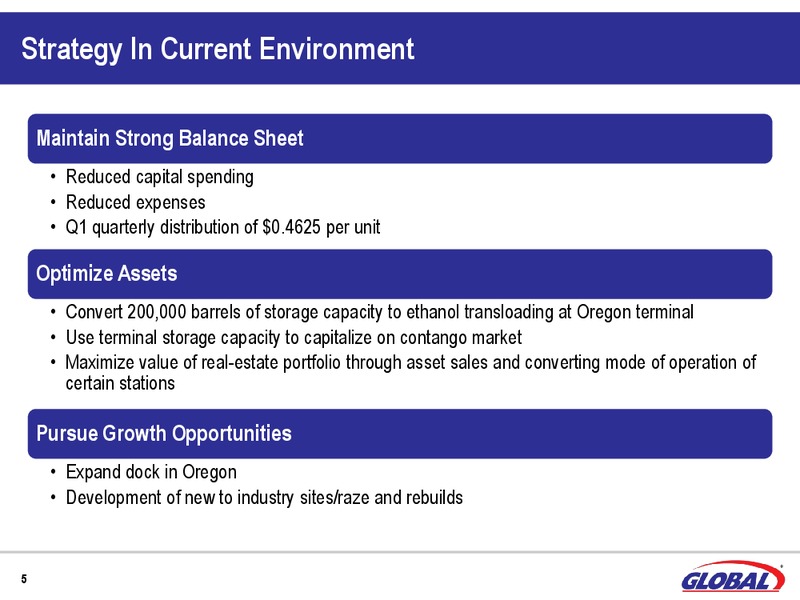
Strategy In Current Environment Maintain Strong Balance Sheet Reduced capital spending Reduced expenses Q1 quarterly distribution of 0.4625 per unit Optimize Assets Convert 200,000 barrels of storage capacity to ethanol…
Globals DNA Sourcing and Logistics Origin and Transportation Delivery and Storage Integrated Marketing Wholesale Distribution Retail C-Store Operations 6
Global by the Numbers 25 Refined Petroleum Bulk Product Terminals 12.2M Barrels of Storage Capacity 348K Barrels of Product Sold Daily 1,500 Gas Stations Owned, Leased or Supplied * 274 Company-operated Convenience Stores…
How Large is Globals Refined Fuels Network Gasoline* 698K Automobile tanks filled/day Diesel fuel 17K Diesel trucks filled/day TTM as of 3/31/2016 Heating oil 37K Homes heated/day in winter *Total gasoline volume sold…
History of Growth 1.7 Billion in Acquisitions and Investments Expanded retail portfolio Acquired three with the addition of 22 leased Receipt, storage and Opened NGL terminals sites in Western Mass. distribution of Bakken crude…
Growth Strategy Conservative Financial Approach and Strong Capitalization Organic Growth Initiatives Strategic Acquisitions Enhance cash flow through product and market Consolidate markets and leverage scale to diversification…
Business Overview
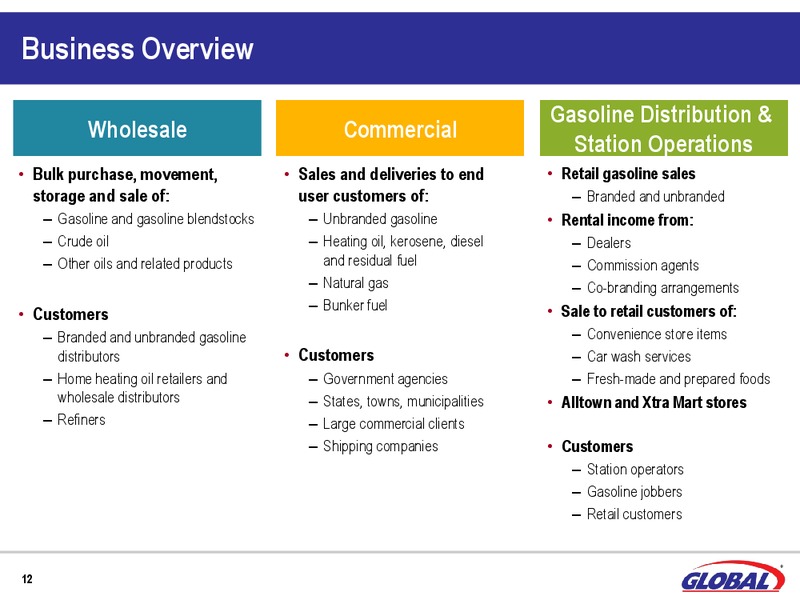
Business Overview Gasoline Distribution & Wholesale Commercial Station Operations Bulk purchase, movement, Sales and deliveries to end Retail gasoline sales storage and sale of: user customers of: Branded and unbranded Gasoline and…
Vertical Integration Tanker Gas station Retail Barge Truck Wholesale Rack Consumer Rail Rail Commercial Storage Facilities Pipeline Barge Industrial Truck Refinery Wholesale Commercial Gasoline Distribution &…
Wholesale Segment
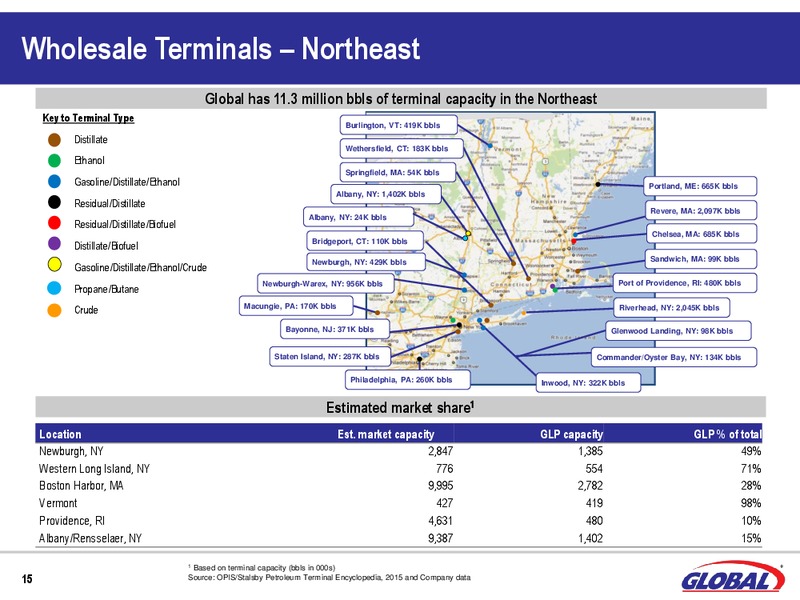
Wholesale Terminals Northeast Global has 11.3 million bbls of terminal capacity in the Northeast Key to Terminal Type Burlington, VT: 419K bbls Distillate Wethersfield, CT: 183K bbls Ethanol Springfield, MA: 54K bbls…
Rail Logistics Clatskanie, OR Terminal Basin Stampede, ND Basin Beulah, ND Albany, NY Terminal 16
Albany Terminal Critical Link in North American Infrastructure Receipt, storage and delivery of multiple petroleum products Gasoline Ethanol Heating oil Crude oil Significant intermodal flexibility Rail Barge Truck 17
Initiatives Underway at Oregon Terminal Infrastructure projects Upgrading terminal dock to handle Panamax- class vessels Converting facilitys 200,000 bbls of storage to ethanol transloading Projects expected to be completed in Q3…
Gasoline Distribution & Station Operations Segment
One of the Largest Operators of Gasoline Stations and Convenience Stores in the Northeast Large gasoline station and C-store portfolio Supply 1,500 locations in 11 states Own or control 830 sites; approximately 50% owned Brands…
GDSO Segment is Downstream Link in Vertically Integrated Supply Chain Strategic Advantages Annuity business: Rental income from Dealer Leased and Commission Agents Vertical integration: Integration between supply, terminaling and…
Organization of GDSO Segment 274 Company Operated Stores 283 Commission Agents 274 Lessee Dealers 667 Contract Dealers Data as of 3/31/2016 22
Warren Equities: A Transformative Acquisition for Globals Retail Platform Completed in January 2015 (included 148 convenience stores, 33 commission agent locations and approximately 330 dealers) Meaningfully expands scale while…
Acquired Retail Portfolio from Capitol Petroleum Group Completed in June 2015 Expands Globals presence in two 80 Clifton Clifton Clifton Clifton Clifton Hackensack Hackensack Hackensack Hackensack Hackensack Hackensack 95…
Expanded Retail Portfolio in Western Massachusetts 22 gas stations and convenience stores in Pittsfield and Springfield regions Added through long-term leases Shell and Mobil fuel brands 25
GDSO Segment - Growth Through Organic and M&A Initiatives Organic Projects: Raze and rebuilds New-to-industry sites Real Estate Focus: Optimize real-estate portfolio through asset sales Convert mode of operation of certain…
Commercial Segment
Commercial Segment Overview Delivered fuels business commercial and industrial, as well as federal agencies, states, towns and municipalities Through competitive bidding process or through contracts of various terms Bunkering marine…
Expertise and Competitive Strengths Expertise Representative Customers Marketing, logistics and transportation Competitive strengths Reliability Terminal locations Customer base 29
Financial Summary
Q1 2016 Financial Performance Q1 2016 GDSO product margin increased by 9.9M, or 10%, YOY to 108.3M, driven by the acquisition of the retail portfolio from Capitol Petroleum. Fuel margin negatively impacted by rising wholesale gasoline…
Financial Profile Product Margin EBITDA DCF ( in millions) ( in millions) ( in millions) *Includes 5.5 million impairment charge related to assets classified as held for sale and 2.3 million loss on the sale of gasoline stations.…
Volume and Margin Consistency/Repeatability Variability Driving cars & trucks Market and economic conditions Heating buildings and homes Weather Term contracts Seasonality Rental income and C-Store sales Station Operations Margin…
Conservative Distribution Policy Global has generated 252.2 million in Excess DCF since its IPO with an average DCF coverage ratio of 1.5x since 2006 DCF Coverage Cumulative Excess Cash Flow Reinvested in GLP ( in millions) Period…
Balance Sheet at March 31, 2016 Tangible and liquid with receivables and inventory comprising 27% of total 335 (26%) of total debt at 3/31/16 related to inventory financing assets at 3/31/16 Borrowed under working capital facility…
Planned Capital Investments for 2016 Maintenance capex of approximately 35M 30M related to expenses associated with retail sites and GDSO Balance for terminals and IT infrastructure Expansion capex of 30-35M Raze-and-rebuilds…
Appendix
Appendix Financial Reconciliations: Net Income to EBITDA GLOBAL PARTNERS LP FINANCIAL RECONCILIATIONS - EBITDA (In thousands) (Unaudited) Trailing Twelve Three Months Ended Months Ended Year Ended December 31, March 31, March…
Appendix Financial Reconciliations: Net Income to DCF GLOBAL PARTNERS LP FINANCIAL RECONCILIATIONS - DISTRIBUTABLE CASH FLOW (In thousands) (Unaudited) Trailing Twelve Three Months Ended Months Ended Year Ended December 31, March…
Appendix Financial Reconciliations: Gross Profit to Product Margin GLOBAL PARTNERS LP FINANCIAL RECONCILIATIONS - PRODUCT MARGIN (In thousands) (Unaudited) Trailing Twelve Three Months Ended Months Ended Year Ended December 31,…
 Loading...