Key Investment Highlights Extensive reserves of natural gas* 10.0 Tcfe proved; 16 years R/P 6.3 Tcfe proved developed 78 Tcfe total resource potential Proven ability to profitably develop our reserves Six consecutive years of 25%…
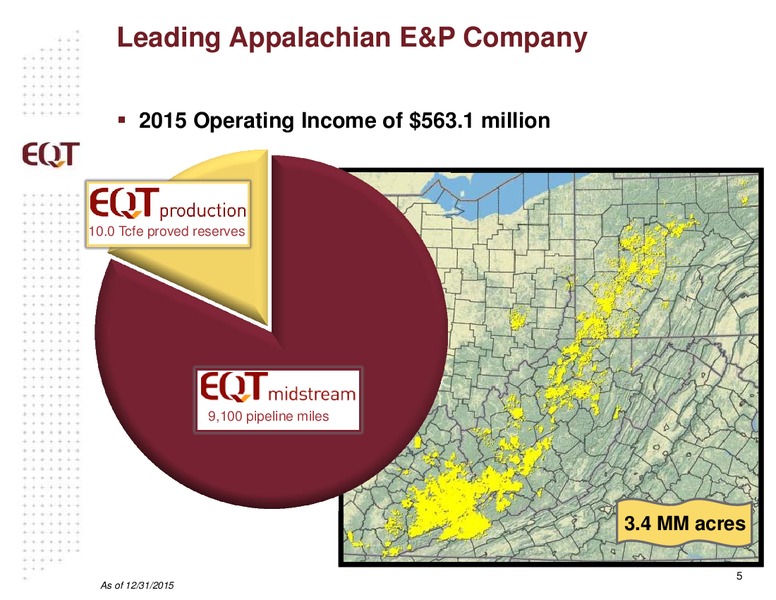
Leading Appalachian E&P Company 2015 Operating Income of 563.1 million 10.0 Tcfe proved reserves 9,100 pipeline miles 3.4 MM acres 5 As of 12/31/2015
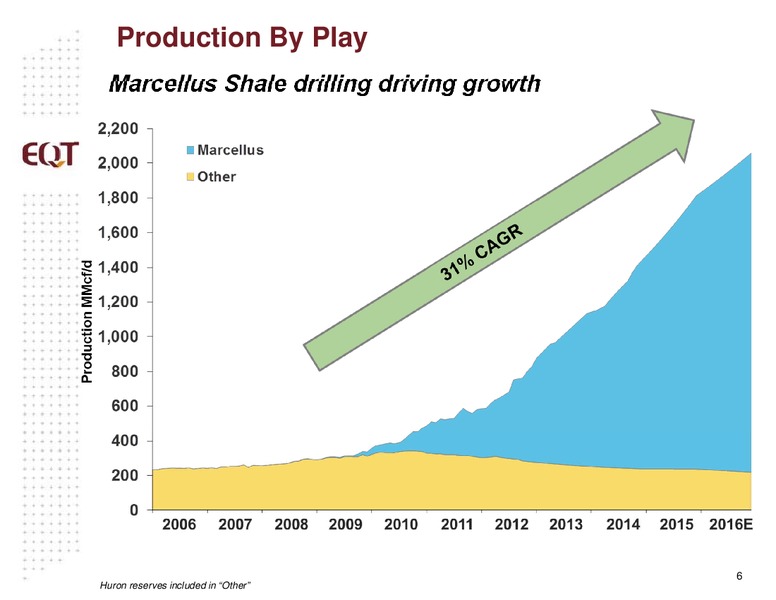
Production By Play Marcellus Shale drilling driving growth 6 Huron reserves included in Other
Proved Reserves 12.0 10.0 8.0 3.7 5.9 Tcfe 6.0 4.4 2.4 3.2 4.0 6.3 4.8 2.0 4.0 3.0 2.8 0.0 2011 2012 2013 2014 2015 Proved Developed Proved Undeveloped 78 Tcfe Total Resource Potential 7 As of 12/31/2015
Marcellus Play 660,000 EQT acres 86% NRI / 80% HBP 7.8 Tcfe proved reserves 31 Tcfe total resource potential 72 wells in 2016 Core Development Area 8 *As of 12/31/2015 and pro forma for the Statoil acquisition
Marcellus Core Development Area Near term development strategically focused on core 320,000 EQT acres* 3,370 locations* 630 wells online* 72 wells in 2016: 51 PA wells 21 WV wells 7,000 laterals 6.3 MM / well 14.5 Bcfe EUR /…
Utica Play 450,000 EQT acres* Shipman 593894 Pettit 593066 Greene County, PA 3,400 locations* Greene County, PA 7,000 lateral 5,200 lateral 3 wells online 5-10 wells in 2016 13,000 to 13,500 deep Scotts Run 591340 Greene County,…
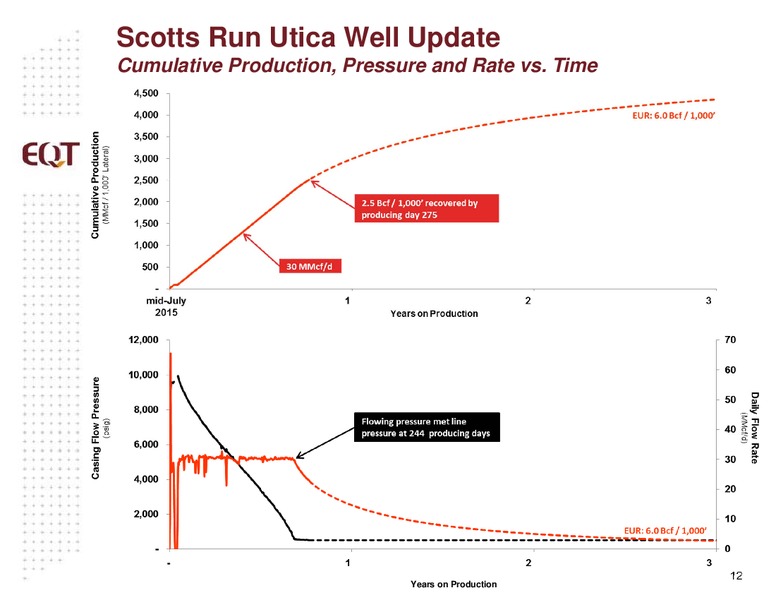
Scotts Run Utica Well Update Cumulative Production, Pressure and Rate vs. Time 12 Years on Production
Scotts Run Utica Type Curve 5,400 lateral 35,000 30,000 Utica 6.0 MMcf/ft 25,000 Daily Production (Mcf/d) ATAX IRR (2.00 Realized Price) Well Cost 6.0 MMcf/ft 20,000 12.5 MM 85% 14.0 MM 65% 15,000 10,000…
EQT Corporation Midstream Overview Consolidated Transmission & Storage* 3.6 Bcf/d current capacity 47 Bcf gas storage capacity Gathering* 2 Bcf/d capacity Formed MLP in 2012 (NYSE: EQM) EQT Corporation Adjusted EQT Midstream…
EQT Corporation Midstream Midstream Assets Allegheny Valley Allegheny Tioga Valley 65 MMcf/d Connector Connector 200-mile FERC pipeline Longhorn 130 MMcf/d 450 MMcf/d capacity 40 MM projected annual Terra 80 MMcf/d EBITDA…
EQT GP Holdings, LP (NYSE: EQGP) EQT owns 90% LP interest of EQGP EQGP owns in EQM* 28% limited partner interest 1.8% general partner interest incentive distribution rights EQGP Price Value of EQGP Units Value per per Unit…
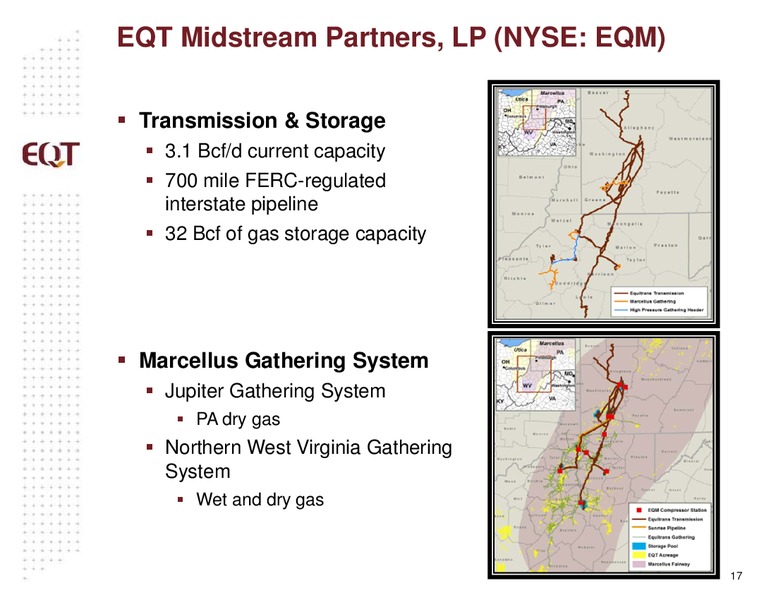
EQT Midstream Partners, LP (NYSE: EQM) Transmission & Storage 3.1 Bcf/d current capacity 700 mile FERC-regulated interstate pipeline 32 Bcf of gas storage capacity Marcellus Gathering System Jupiter Gathering System PA dry…
EQT Midstream Partners, LP Growth Projects Ohio Valley Connector 37-mile FERC regulated pipeline to connect transmission in West Virginia to Clarington, OH Year-end 2016 in-service 1 Bcf/d capacity 650 BBtu/d contracted under…
Corporate Citizenship Safety Our first priority All accidents are preventable Company goal = zero incidents Committed to: The environment Our employees and contractors The communities where we drill and work EQT Foundation…
Investment Summary Extensive reserves of natural gas Proven ability to profitably develop our reserves Six consecutive years of 25% production growth 19% production sales volume growth in 2016 Extensive and growing midstream…
Appendix 21
Statoil Acreage Acquisition, May 2016 62.5k Marcellus / 53k Utica net acres 500 new Marcellus locations of 5,600 Stacked pay Existing Production 24 producing Marcellus wells 3 complete, not online 4 drilled, not complete 50…
Acreage Acquisition Summary, May 2016 Acquisition Metrics Net Marcellus Acres 62,500 Net Utica Acres 53,000 Working Interest 100% Net Revenue Interest 84% Held by Production or Term 2018+ 87% Current Production* 50MMcfe/d…
Ample Financial Flexibility to Execute Business Plan EQT Debt ratings Moodys Standard & Poors Fitch Long-term debt Baa3 BBB BBB- Outlook Stable Stable Stable Strong balance sheet ( MM, except net debt / capital) March 31,…
 Loading...