COMPANY OVERVIEW 1,400 Consolidated Revenues Operating Segments: Full Year 1,200 First Quarter 1,118 Fluids Systems 1,042 984 Mats and Integrated Revenues ( millions) 1,000 909 Services 800 677 600 Customer markets: 400…
GLOBAL PRESENCE First Quarter 2016 Revenue by Region U.S. EMEA Latin America APAC Canada 1% 11% 8% 44% 36% 4
FLUID SYSTEMS OVERVIEW Total Segment Revenues 1,200 Full Year Largest independent drilling 1,000 First Quarter 862 926 965 fluids provider 3rd largest drilling fluids Revenues ( millions) 800 799 600 581 company…
FLUIDS SYSTEMS NORTH AMERICA 800 North American Revenues Revenues impacted by sharp 687 700 654 Full Year decline in drilling activity and Revenue ( millions) 585 615 First Quarter 600 operators reducing well 500…
EXPANSION INTO DEEPWATER GOM Deepwater foundation established in Brazil Expanded into Black Sea in 2014 Uruguay ultra-deepwater project in 2016 Deepwater market penetration aligns with efforts to expand IOC/NOC relationships…
FLUID SYSTEMS - INTERNATIONAL 350 International Revenues International expansion is key to our strategy Full Year 300 First Quarter 272 278 More stable than NAM, as demonstrated in 246 250 214 229 2015 200 Longer term contracts 150…
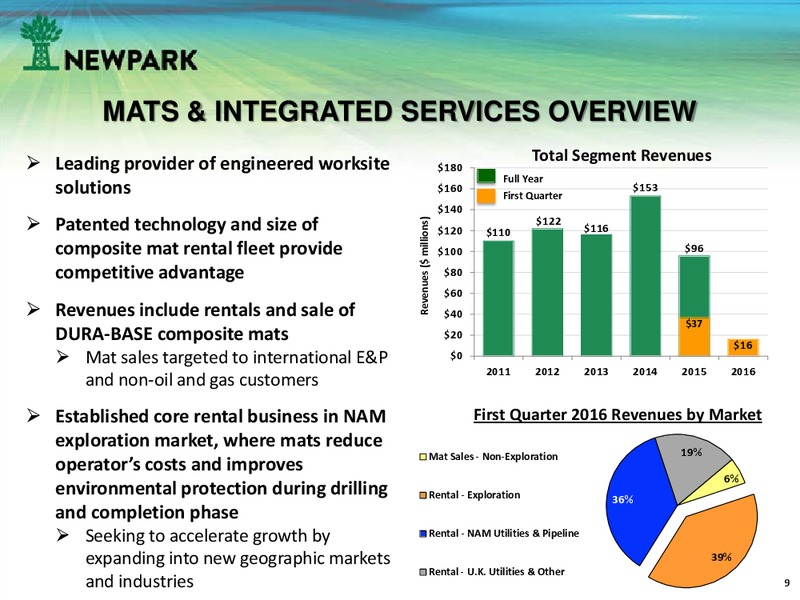
MATS & INTEGRATED SERVICES OVERVIEW Leading provider of engineered worksite Total Segment Revenues 180 Full Year solutions 160 First Quarter 153 140 Patented technology and size of 122 Revenues ( millions) 120 110 116…
MATS & INTEGRATED SERVICES STRATEGY Key investments made to support future growth Manufacturing capacity expanded R&D center completed Transform wellsite offering to system solution, driving lowest cost to operators Defender…
NAVIGATING THROUGH THE CYCLE Capital Structure Short-Term Actions Total Debt Net Debt Debt to Book Capital Ratio Actively monitoring and adjusting 300 35% cost structure to match current 256 250 32% activity levels 200 209…
CONSOLIDATED STATEMENTS OF OPERATIONS (Unaudited) Three Months Ended March 31, December 31, March 31, (In thousands, except per share data) 2016 2015 2015 Revenues 114,544 150,587 208,464 Cost of revenues 111,573 141,941 176,634…
OPERATING SEGMENT RESULTS (Unaudited) Three Months Ended March 31, December 31, March 31, (In thousands) 2016 2015 2015 Revenues Fluids systems 98,651 130,125 171,902 Mats and integrated services 15,893 20,462 36,562 Total revenues…
CONSOLIDATED BALANCE SHEETS (Unaudited) March 31, December 31, (In thousands, except share data) 2016 2015 ASSETS Cash and cash equivalents 82,534 107,138 Receivables, net 188,451 206,364 Inventories 154,638 163,657 Prepaid…
CONSOLIDATED STATEMENTS OF CASH FLOW (Unaudited) Three Months Ended March 31, (In thousands) 2016 2015 Cash flows from operating activities: Net income (loss) (13,300) 993 Adjustments to reconcile net income to net cash provided by…
EXPERIENCED LEADERSHIP Paul Howes President & CEO Gregg Piontek VP & CFO Mark Airola SVP, GC & Admin Officer Bruce Smith President Fluids Systems Matthew Lanigan President Mats & Integrated Services 17
 Loading...