USA Compression Partners, LP J.P. Morgan Inaugural Energy Equity Conference June 27 29, 2016
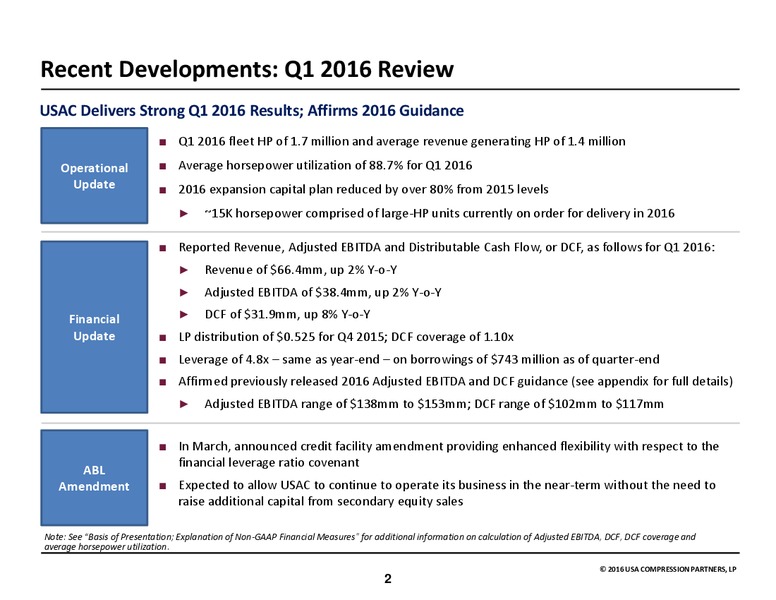
Recent Developments: Q1 2016 Review USAC Delivers Strong Q1 2016 Results; Affirms 2016 Guidance Q1 2016 fleet HP of 1.7 million and average revenue generating HP of 1.4 million Operational Average horsepower utilization of 88.7% for Q1…
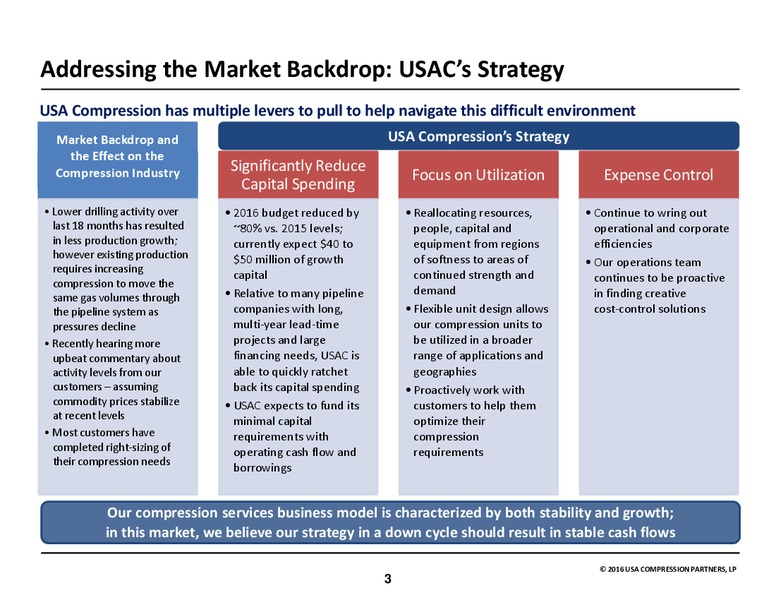
Addressing the Market Backdrop: USACs Strategy USA Compression has multiple levers to pull to help navigate this difficult environment Market Backdrop and USA Compressions Strategy the Effect on the Compression Industry Significantly…
Outlook For Compression and Macro Drivers
Compression Basics and the Need for Compression Critical Infrastructure for US Natural Gas Compression is a mechanical process where natural gas from a lower pressure is smashed What is down (compressed) to a smaller volume which…
Strategic Focus on Infrastructure Applications Compression is a critical service across a range of applications in the production, processing and transportation of oil and natural gas: ompression is a must run service and is required…
Long-Life Deployment Cycle Early to Mid-Innings Horsepower Available for Redeployment Horsepower Variable Horsepower Baseload Horsepower 1 3 5 7 9 11 13 15 17 19 21 23 25 Time (years) USAC meets changing contract…
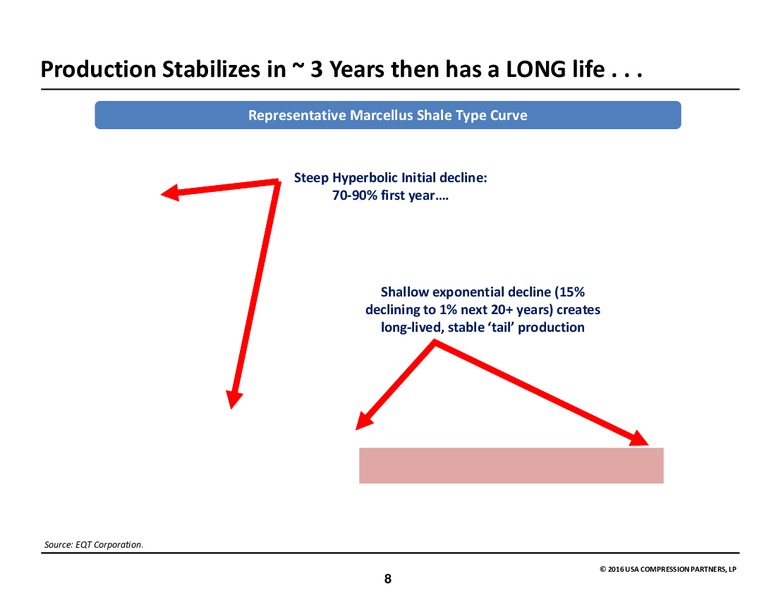
Production Stabilizes in 3 Years then has a LONG life . . . Representative Marcellus Shale Type Curve Steep Hyperbolic Initial decline: 70-90% first year. Shallow exponential decline (15% declining to 1% next 20+ years)…
USAC Business Drivers Compression is Critical Infrastructure for Producing & Transporting Hydrocarbons 85% of USACs business (by HP) installed in natural gas-based applications Overall Gas Demand Projected increasing demand / steady…
Macro Thesis: The Shift to Shale Shale Gas Piece of the Growing Pie Continues to Increase Tcfe 45 42 Tcfe Overall natural gas production expected to increase from 74 Bcf/d in 2015 to 115 Bcf/d through 2040, an 40 increase of 55%…
Growing Shale Compression Requirements Shale Production Drives Increasing Compression Requirements (1) (HP) Shale gas is typically produced at lower wellhead pressures (0-50 PSIG) in contrast to conventional 350,000 gas wells…
Changing, But Still Growing, Natural Gas Market Marcellus/Utica Production Continues to Drive Growth; Expected to Offset 2016 Associated Gas Decline Due to lowered liquids-focused activity since the decline in crude prices in late 2014,…
Natural Gas Demand Poised to Surge Big Four Demand Sources Driving Majority of Expected 38 Bcf/d of New Natural Gas Demand Thru 2040 EIA expects 40 45 gigawatts (GW) of coal-plant retirements in 2016 alone, with 55 GW of Coal Plant…
Natural Gas Demand Poised to Surge, Contd. Industrial Sector, LNG and Pipeline Exports to Mexico Drive Demand Growth Projected Natural Gas Demand LNG Export Capacity Thru 2020 Bcf/d Bcf/d 12.0 140.0 120.0 116.4 Almost 13 Bcf/d of…
USAC: Story of Stability and Growth
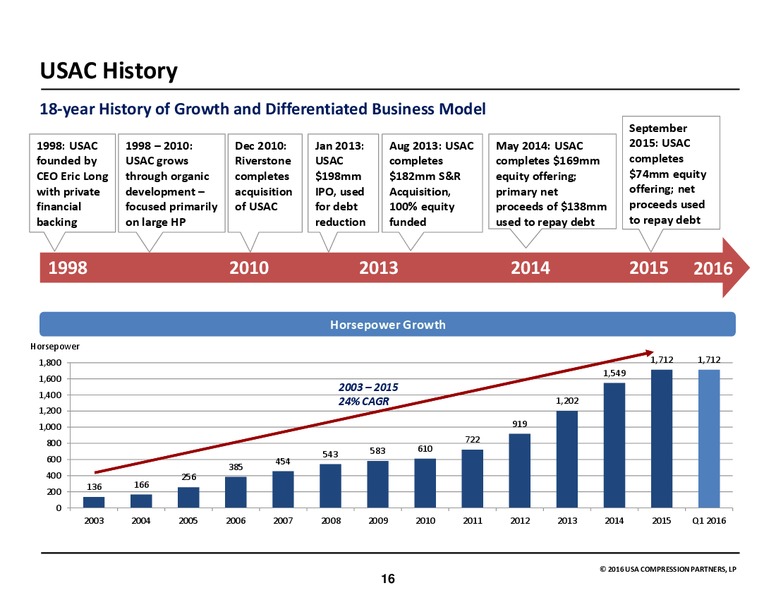
USAC History 18-year History of Growth and Differentiated Business Model September 1998: USAC 1998 2010: Dec 2010: Jan 2013: Aug 2013: USAC May 2014: USAC 2015: USAC founded by USAC grows Riverstone USAC completes completes 169mm…
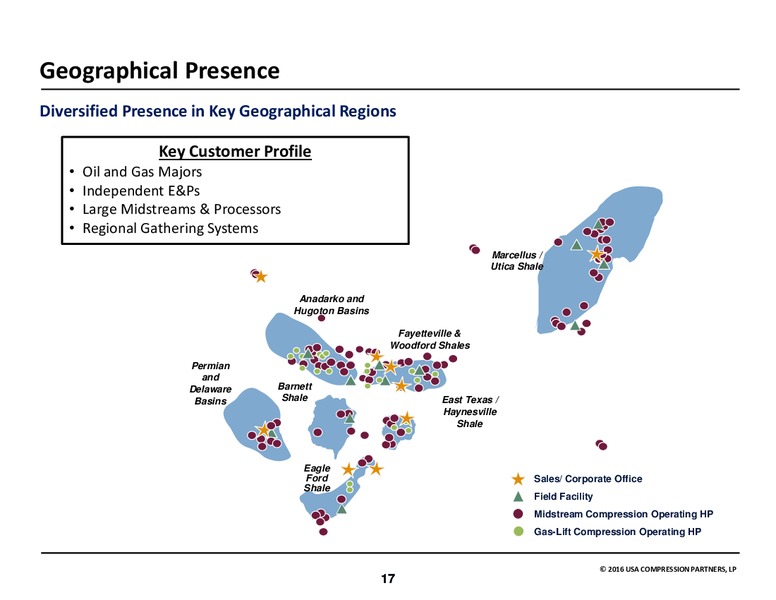
Geographical Presence Diversified Presence in Key Geographical Regions Key Customer Profile Oil and Gas Majors Independent E&Ps Large Midstreams & Processors Regional Gathering Systems Marcellus / Utica Shale Anadarko and…
Business Model Underpinned by Stability Stability Through Multiple Commodity Price Cycles Commodity price levels do Horsepower HH Nat Gas not directly affect USACs Utilization / MMBTU business prospects 100% 14.00 Rather, natural…
Large Horsepower Gas Applications Drives Stability Gas Compression Industry Varies By Size of Compression Unit Gas Compression Industry: Key Characteristics by Size Small Medium Large Extra Large Commentary Compression Unit 400 1,000…
Nature of USA Compressions Contracts Compression Services Contract Profile USA Compressions service contract rates are billed monthly (30 days in advance) and are 100% Contract fixed fee (i.e. contract stipulates XX / month) Service…
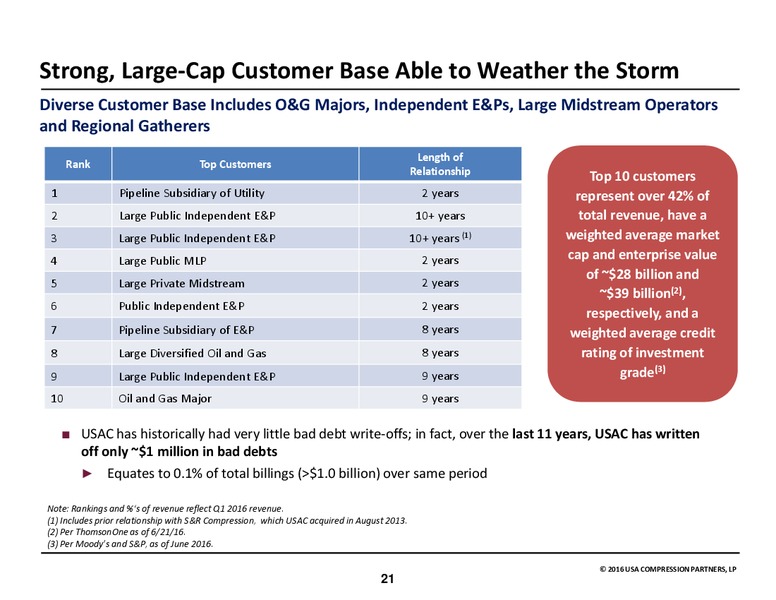
Strong, Large-Cap Customer Base Able to Weather the Storm Diverse Customer Base Includes O&G Majors, Independent E&Ps, Large Midstream Operators and Regional Gatherers Length of Rank Top Customers Relationship Top 10 customers 1…
Fundamentals Result in Cash Flow Stability Infrastructure-Nature of USAC Assets Provide Cash Flow Stability Long asset life complements gathering systems and processing facilities served Long-lived Asset Compression units typically…
Financial Overview and Investment Highlights
USAC Distributions and Leverage Since IPO Prudent Balance Between Distribution Growth, Coverage and Leverage Annualized Distributions per LP Unit USAC Historical Leverage(2) 2.20 8.0x 2.10 2.10 2.10 2.10 7.5x 2.10 2.06 2.00 2.02 2.04…
USAC Investment Highlights USACs Business Prospects Driven By Positive Macro Drivers in the Midstream Industry Continued focus on infrastructure-oriented compression applications; compression is critical to Critical transporting…
Appendix
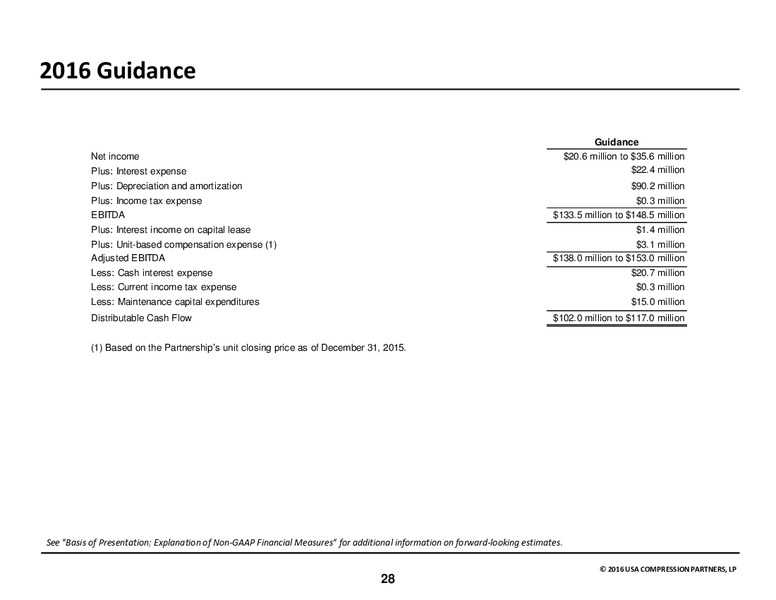
2016 Guidance Guidance Net income 20.6 million to 35.6 million Plus: Interest expense 22.4 million Plus: Depreciation and amortization 90.2 million Plus: Income tax expense 0.3 million EBITDA 133.5 million to 148.5 million Plus:…
USA Compression Ownership Structure USAC is a Pure-play Compression MLP Backed by Experienced Energy Investors Riverstone Holdings & Management 100.0% Membership Interest Public George B. Unitholders Kaiser Affiliates 23.1mm…
Non-GAAP Reconciliations Three Months Ended March 31, Year Ended December 31, 2016 2015 2015 2014 2013 2012 2011 2010 2009 2008 2007 2006 Net income (loss) 8,538 11,456 (154,273) 24,946 11,071 4,503 69 10,479 21,228 20,911 7,122…
Non-GAAP Reconciliations, Contd. Three months ended March 31, December 31, March 31, 2016 2015 2015 Net income (loss) 8,538 (159,630) 11,456 Plus: Non-cash interest expense 467 416 455 Plus: Non-cash income tax expense 102 (202) -…
 Loading...