RSP Permian Overview (NYSE: RSPP) Large, contiguous acreage blocks in the core of the Concentrated Acreage Position in the Core of the Midland Basin Midland Basin 63,000 net surface acres and 262,000 net effective horizontal…
2Q16 Update Average daily production of 26.4 MBoe/d (73% oil, 15% NGLs, 12% Natural Gas), up 7% from 1Q16 and 33% over 2Q15 Financial Results Adjusted EBITDAX of 58.5MM (up 64% from 1Q16), on 57.6MM of 2Q16 development Capex Net…
2016 Horizontal Well Performance Exceeding Type Curves The average of all operated horizontal wells brought online in 2016 YTD is outperforming the weighted average internal type curve by 20% This group of wells includes, among others,…
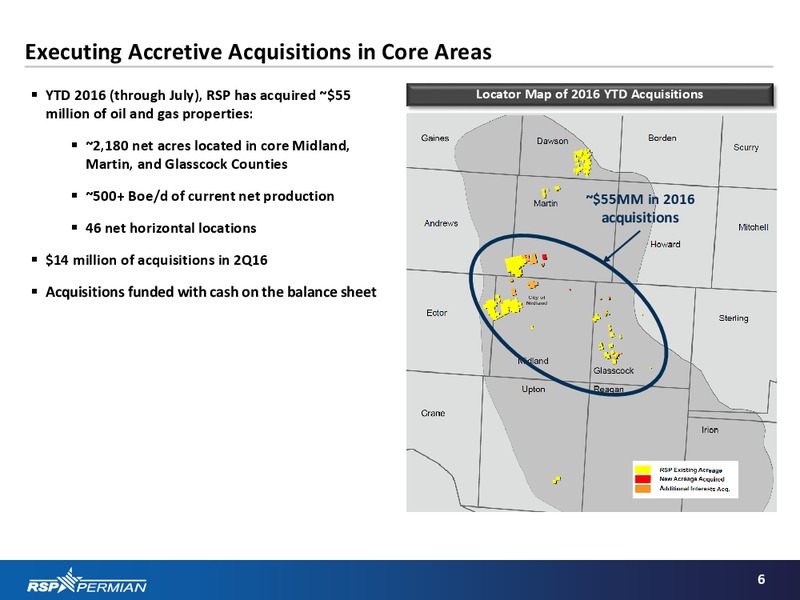
Executing Accretive Acquisitions in Core Areas YTD 2016 (through July), RSP has acquired 55 Locator Map of 2016 YTD Acquisitions million of oil and gas properties: 2,180 net acres located in core Midland, Martin, and Glasscock…
Strong Historical Growth with Significant Organic Growth Potential Historical Production Growth Illustrative Rig Scenarios 30.0 Oil Price Operated Debt / Annualized 28.5 Hz Rigs EBITDAX Production Growth 25.0 26.5 55+…
RSP is in a Strong Financial Position Capitalization Table Selective use of capital markets to fund ( in millions) Q2 2016 acquisitions & maintain a strong balance sheet Cash 33 Earliest debt maturity is undrawn Revolving…
Hedging Program Summary RSP opportunistically layers on hedges to protect returns and support planned capital expenditures Recently executed additional deferred premium puts(1) that more than doubled existing downside oil price…
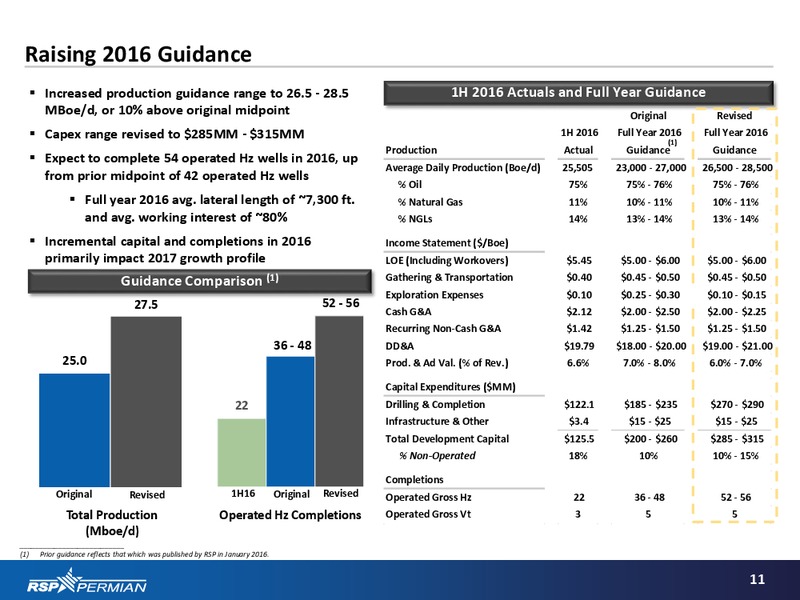
Raising 2016 Guidance Increased production guidance range to 26.5 - 28.5 1H 2016 Actuals and Full Year Guidance MBoe/d, or 10% above original midpoint Original Revised Capex range revised to 285MM - 315MM 1H 2016 Full Year 2016 (1)…
2Q16 Activity Summary In 2Q16 RSP completed 11 operated Hz wells (10 2Q16 DUC Locator LS, 1 WA) and 1 Vt well Ended 2Q16 with 19 operated Hz DUCs (24 non- 1 operated DUCs) distributed across core acreage 4 position 2 Production…
2H16 Operational Activity Update In 2H16, RSP expects to complete 30-34 operated wells 2H16 Operated Completions by Zone 50%+ focused in the Lower Spraberry zone WB 2H16 drilling and completion activity noted below 20%…
Well Costs Continue to Decline Drilling, completion & equipping costs have declined for six straight quarters on an actual and per lateral foot basis Drilling, Completion & Equip. Cost (7,500 lateral)(1) (2) Actual Well Cost / Lateral…
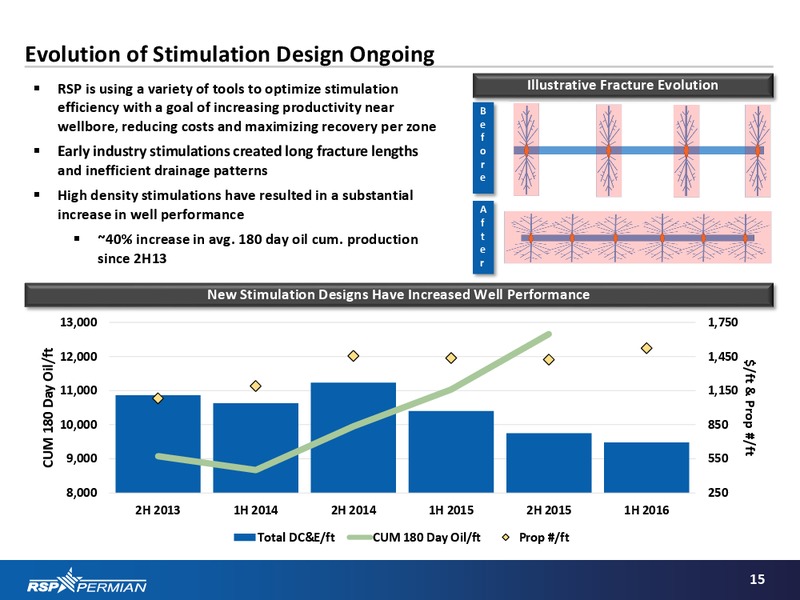
Evolution of Stimulation Design Ongoing RSP is using a variety of tools to optimize stimulation Illustrative Fracture Evolution efficiency with a goal of increasing productivity near B 2013-14 Mid 2014 to YE15 Q1 2016 wellbore,…
Calverley Area Continues to Outperform Two initial Calverley wells continue to Calverley Area Map outperform peer 1MMBOE type curve GLASSCOCK CO MIDLAND CO Two test wells in Glasscock, 3H LS and 4H LWB, are approaching peer 1MMBOE…
Woody Area Continues to Outperform Initial Upper Wolfcamp Woody wells Woody Area Map continue to outperform peer 1MMBOE type MIDLAND CO GLASSCOCK CO curve despite lateral length of just under 5,000 Woody 1H WA Two additional Upper…
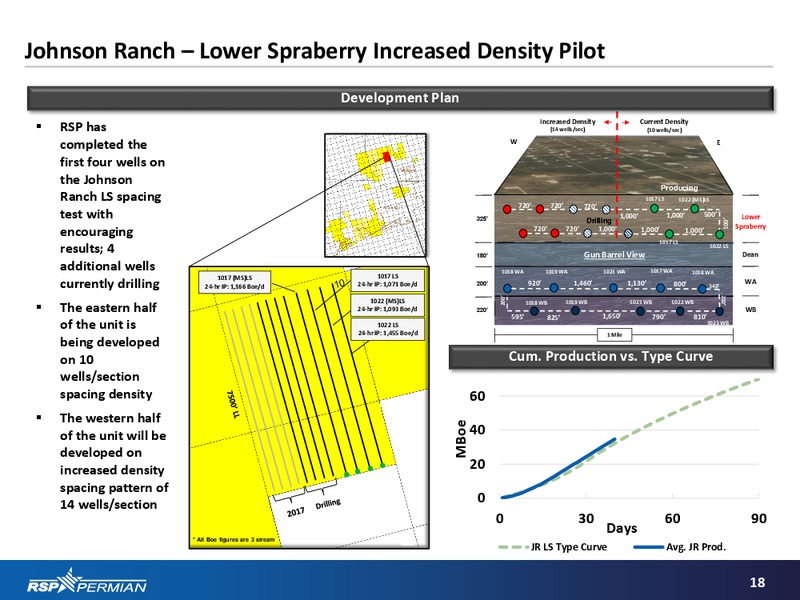
Johnson Ranch Lower Spraberry Increased Density Pilot Development Plan Increased Density Current Density RSP has (14 wells/sec) (10 wells/sec) completed the W E first four wells on the Johnson Producing Ranch LS spacing 720 720…
Optimizing Wellbore Placement 3D Inversion Attribution RSP continues to Geosteering see improving well results using technology to optimize wellbore placement Microseismic Geochem 21
Significant Upside to Focus Area Inventory from Further Downspacing RSP believes spacing tests may show significant Spacing Assumptions (Wells per 1-Mile Section) upside to current spacing assumptions Current Spacing Increased Density…
Extensive Multi-Year Drilling Inventory with Strong Rates of Return Gross Focus Area Horizontal Inventory Net Focus Area Horizontal Inventory 4,371 Net Locations…
Adjusted EBITDAX and Adjusted Net Income Reconciliation Reconciliation of Adjusted EBITDAX to Net Income (in thousands) Three Months Ended Three Months Ended June 30, March 31, 2016 2015 2016 Net income (loss) (9,801) (5,453)…
 Loading...