THE U.S. SILICA STORY Industry Leader - Winning in a Tough Market Operating Competitive Business Balance Sheet segments advantages model Diversified Strong Resilient Best 3
AT A GLANCE U.S. Silica Strength in Numbers Raw frac sand provider in world Top 2 Market positions in ISP 1 or 2 Operating facilities 17 Tons of reserves 400M Tons sold in 2015 10M Earnings from non-energy, stable industrial…
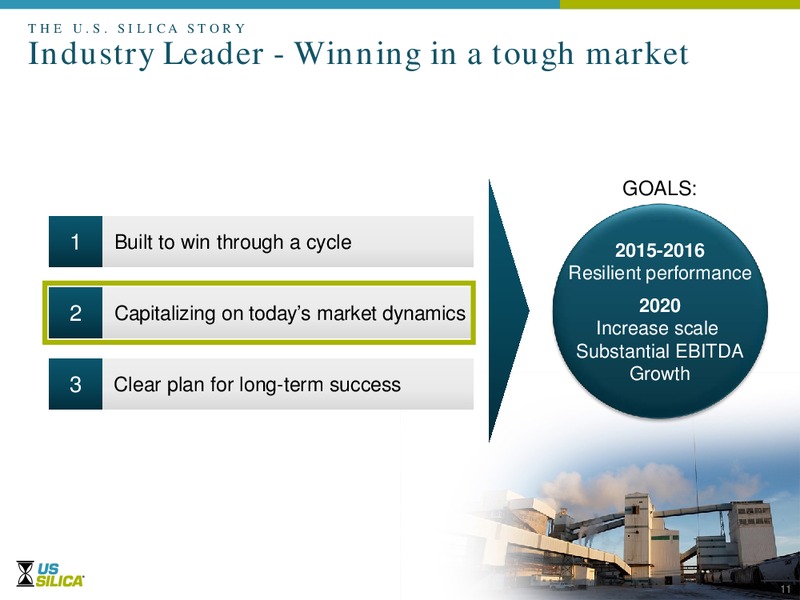
THE U.S. SILICA STORY Industry Leader - Winning in a Tough Market GOALS: 1 Built to win through a cycle 2015-2016 Resilient performance 2 Capitalizing on todays market dynamics 2020 Increase scale Substantial EBITDA Growth 3…
A Differentiated Business Model 1 Unmatched scale and resources 2 Advantaged distribution Strong, sustainable competitive advantages 3 Attractive customer mix 4 Strong financial position 6
1. Unmatched Scale and Resources C A N A D A 17 production facilities Low cost production 49 transload terminals Well positioned in best basins Operating Facilities Oil & Gas ISP Planned Transload Terminals 7
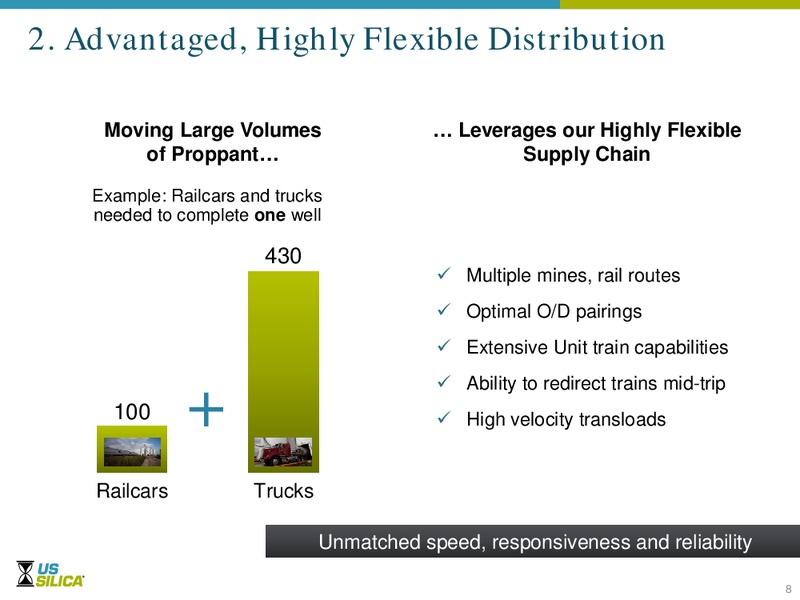
2. Advantaged, Highly Flexible Distribution Moving Large Volumes Leverages our Highly Flexible of Proppant Supply Chain Example: Railcars and trucks needed to complete one well 430 Multiple mines, rail routes Optimal O/D…
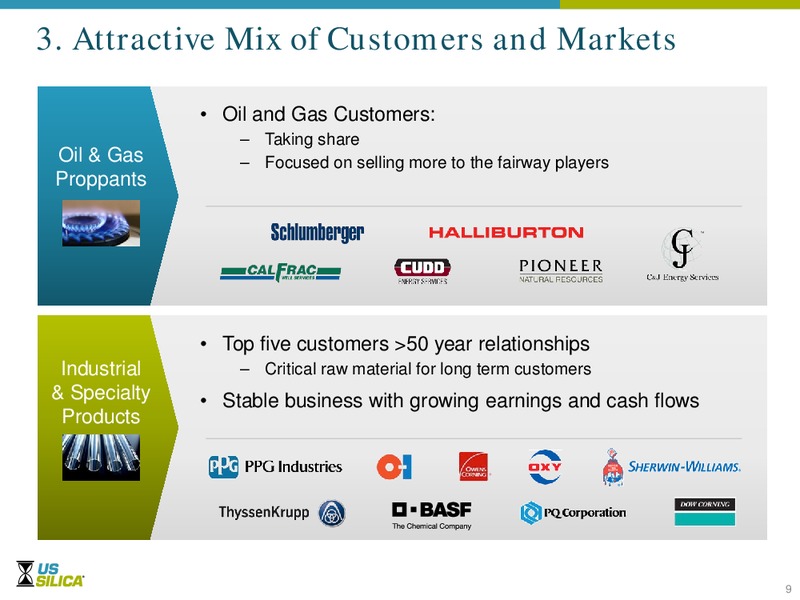
3. Attractive Mix of Customers and Markets Oil and Gas Customers: Taking share Oil & Gas Focused on selling more to the fairway players Proppants Top five customers 50 year relationships Industrial Critical raw material for…
4. Best Balance Sheet vs. Peers 1 Most Available Cash 300M Stability 2 Lowest Net Debt 193M Flexibility Sustainability 3 Best Debt/Equity Ratio 1.27 Peer group includes FMSA, HCLP, EMES. 10
THE U.S. SILICA STORY Industry Leader - Winning in a tough market GOALS: 1 Built to win through a cycle 2015-2016 Resilient performance 2 Capitalizing on todays market dynamics 2020 Increase scale Substantial EBITDA Growth 3…
Aggressively Growing Proppant Share Market Demand at 70% of 2014 2015 SLCA Sales Volume at 90% of 2014 Average rig Sand per count well down 47% up 15% 2014 2015 2014 2015E 12
Leveraging Our Speed, Scale & Strength SPEED SCALE STRENGTH Multiple mines on Strong balance Working with our multiple railroads sheet supply chain partners to take More transloads Talented & capable costs out closer to the…
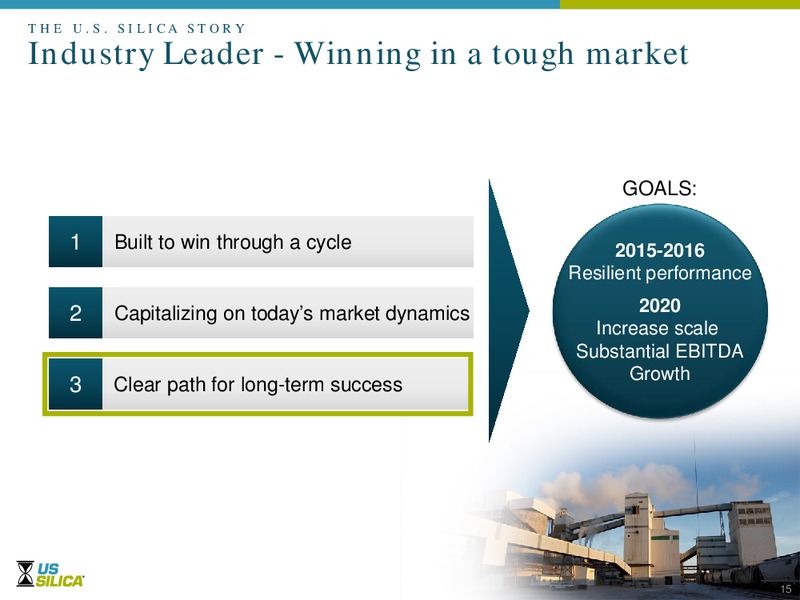
THE U.S. SILICA STORY Industry Leader - Winning in a tough market GOALS: 1 Built to win through a cycle 2015-2016 Resilient performance 2 Capitalizing on todays market dynamics 2020 Increase scale Substantial EBITDA Growth 3…
Key Initiatives to Drive Success 4 Drive consolidation: accretive 3 Enhance acquisitions Industrial & Specialty business 2 Leverage supply chain to gain share 1 Effectively manage downturn 16
INITIATIVE 1 Effectively Manage the Downturn Capture share Partner with the right customers Laser focus on cost Focus Increase fixed cost leverage Disciplined capital spending Help drive industry consolidation Utilize our…
INITIATIVE 2 Leverage Supply Chain Network Facilities in the right places, with the right products, at the best price Taking market share in Oil & Gas Emphasize high-velocity transloads Get even closer to the wellhead Reduce…
INITIATIVE 3 Enhance Industrial & Specialty Business Solid, stable cash flow business Investing in Innovation Introducing higher-margin, value 37 added specialty products to grow EBITDA Optimizing product mix Delivered record…
INITIATIVE 4 Drive consolidation in a fragmented industry Our customers are consolidating Reducing suppliers Scale matters 30% Top 10: Strong financial smaller suppliers 70% position Source: PropTester, Inc. and…
2016 Outlook Expect 2016 to be similar to 2H15 Anticipate volumes returning before pricing Fixed cost leverage challenges will continue ISP markets and profitability expected to stay strong Cost improvement projects will yield…
 Loading...