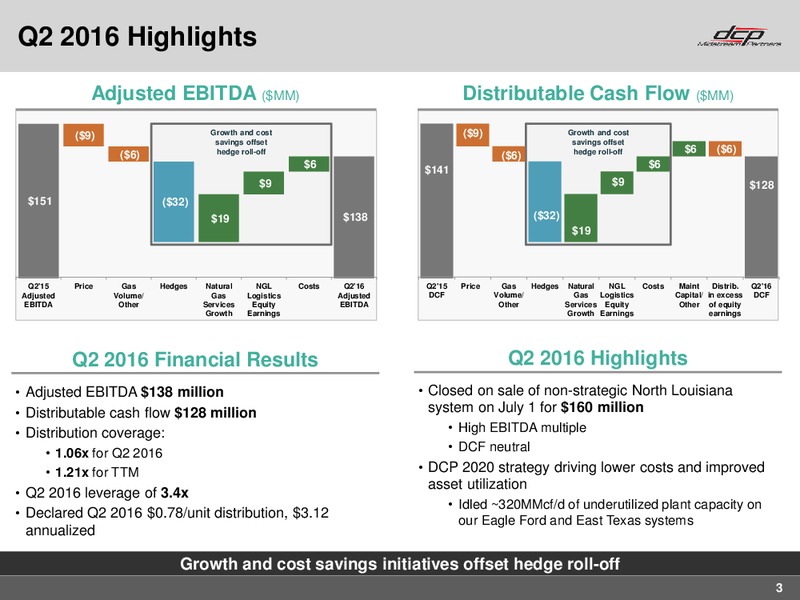
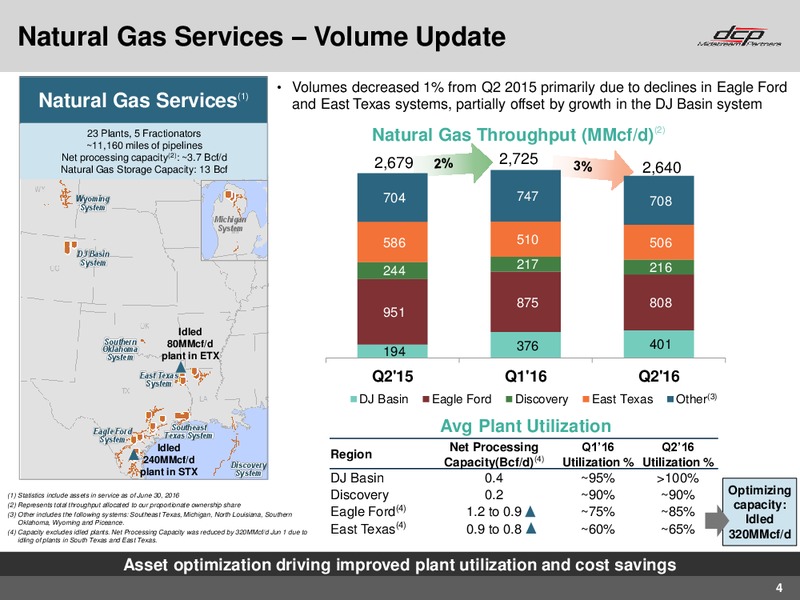
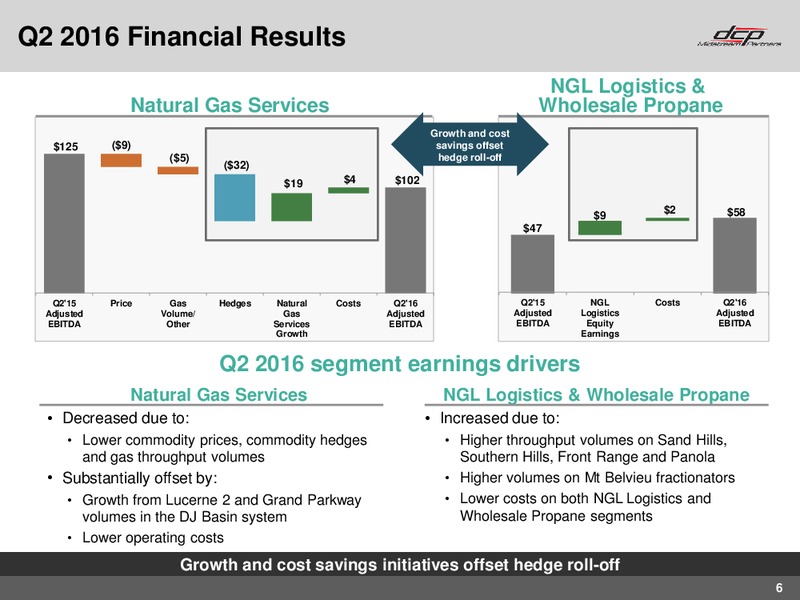
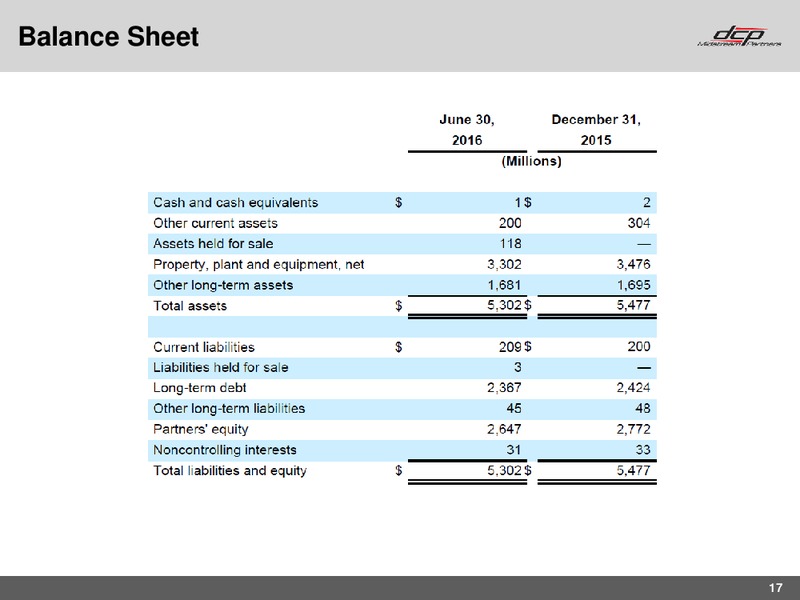
Natural Gas Services Volume Update Volumes decreased 1% from Q2 2015 primarily due to declines in Eagle Ford (1) Natural Gas Services and East Texas systems, partially offset by growth in the DJ Basin system 23 Plants, 5…
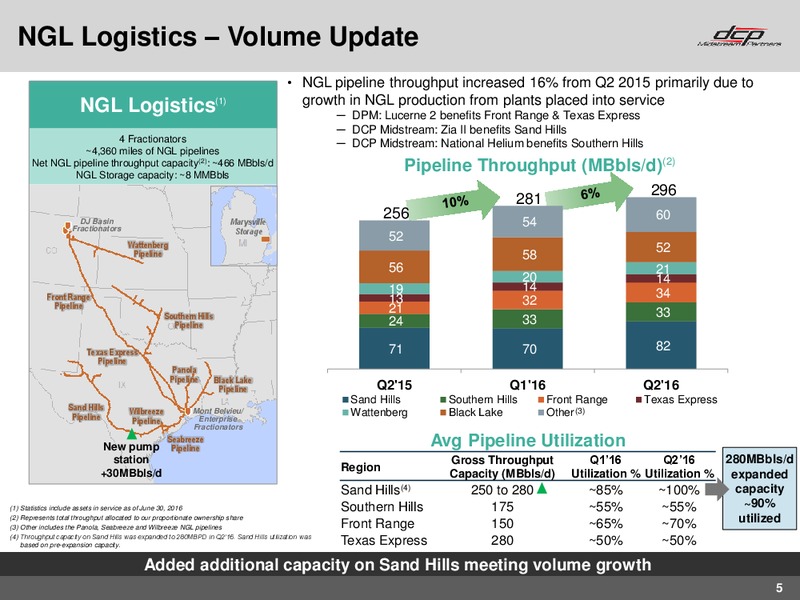
NGL Logistics Volume Update NGL pipeline throughput increased 16% from Q2 2015 primarily due to growth in NGL production from plants placed into service NGL Logistics(1) DPM: Lucerne 2 benefits Front Range & Texas Express DCP…
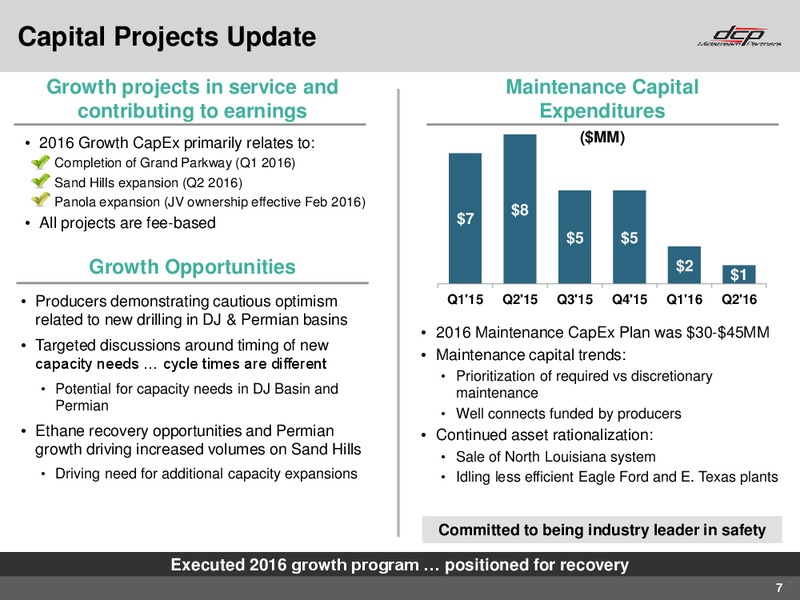
Capital Projects Update Growth projects in service and Maintenance Capital contributing to earnings Expenditures 2016 Growth CapEx primarily relates to: (MM) Completion of Grand Parkway (Q1 2016) Sand Hills expansion (Q2 2016)…
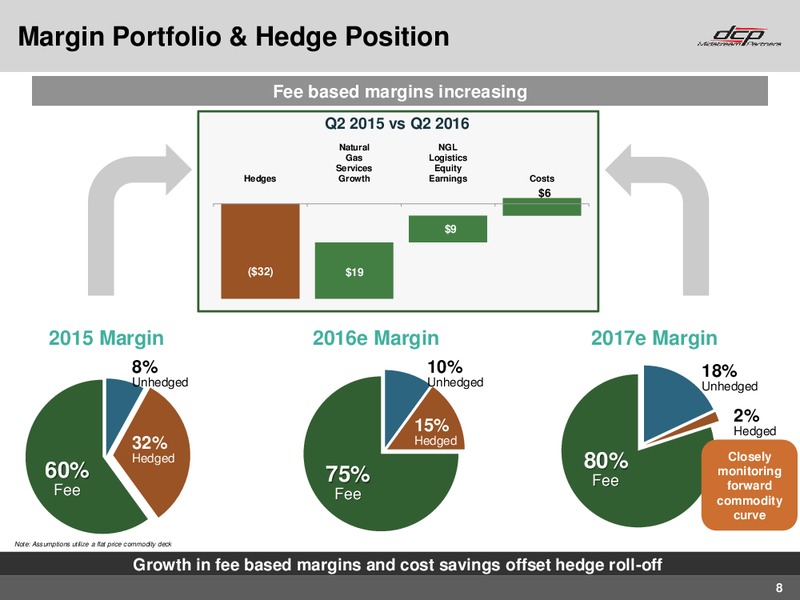
Margin Portfolio & Hedge Position Fee based margins increasing Q2 2015 vs Q2 2016 Natural NGL Gas Logistics Services Equity Hedges Growth Earnings Costs 6 9 (32) 19 2015 Margin 2016e Margin 2017e Margin 8% 10% 18%…
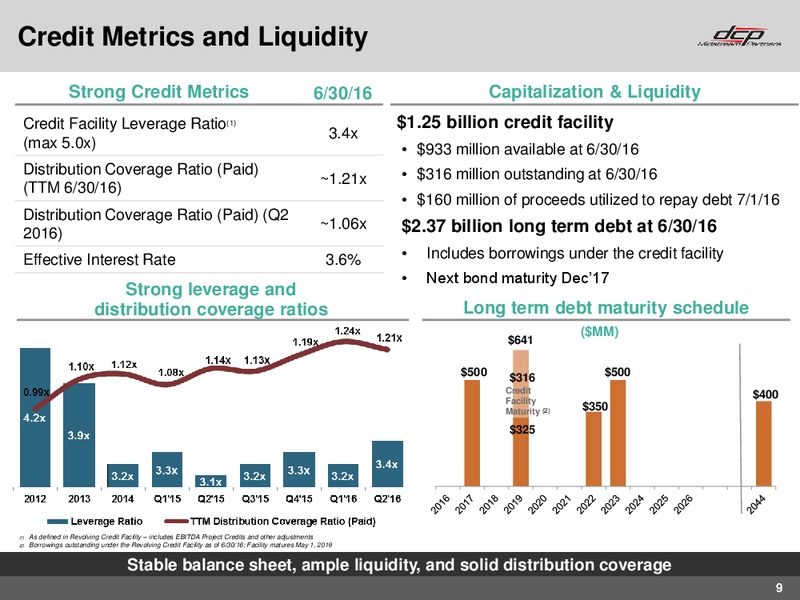
Credit Metrics and Liquidity Strong Credit Metrics 6/30/16 Capitalization & Liquidity Credit Facility Leverage Ratio(1) 1.25 billion credit facility 3.4x (max 5.0x) 933 million available at 6/30/16 Distribution Coverage Ratio (Paid)…
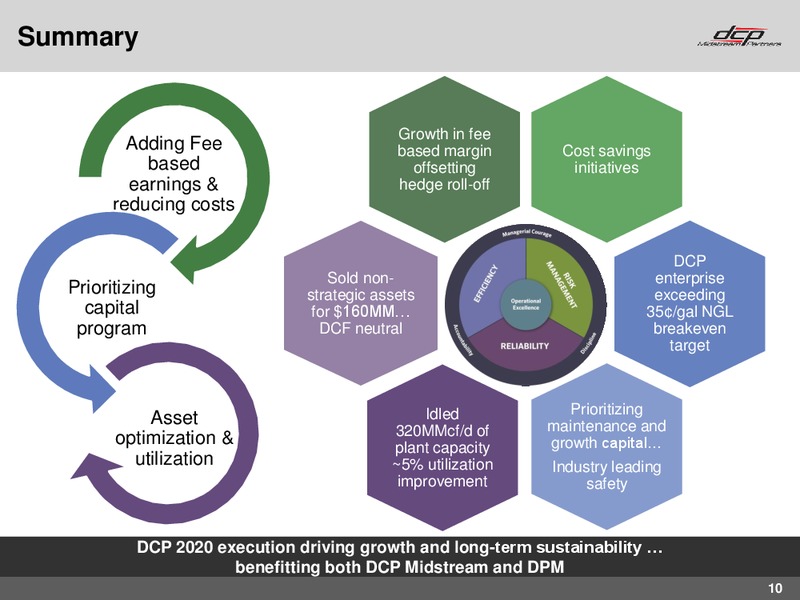
Summary Growth in fee Adding Fee based margin Cost savings based offsetting initiatives earnings & hedge roll-off reducing costs DCP Sold non- enterprise Prioritizing strategic assets exceeding capital for 160MM 35/gal NGL…
Supplemental information appendix
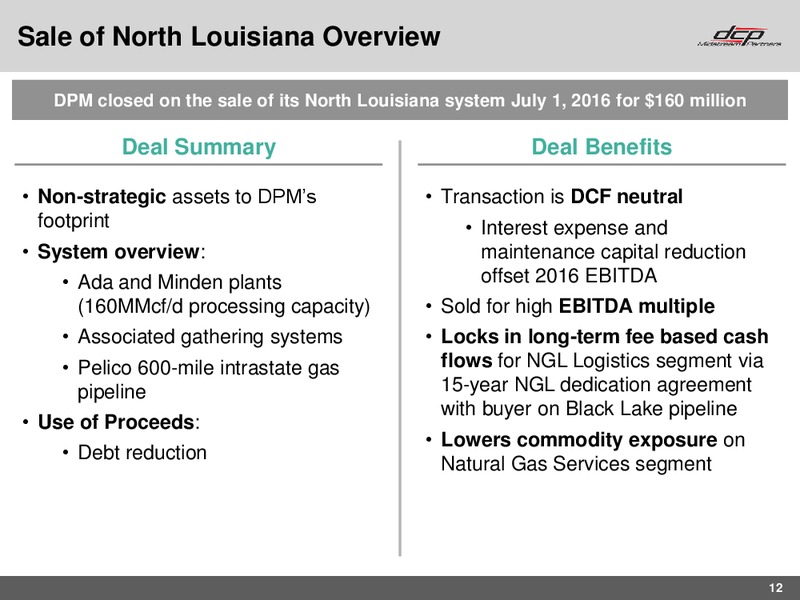
Sale of North Louisiana Overview DPM closed on the sale of its North Louisiana system July 1, 2016 for 160 million Deal Summary Deal Benefits Non-strategic assets to DPMs Transaction is DCF neutral footprint Interest expense and…
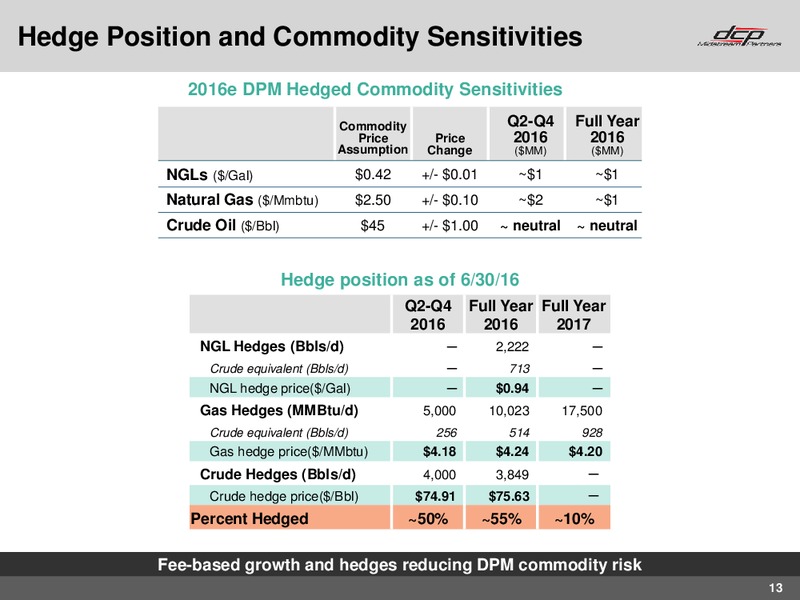
Hedge Position and Commodity Sensitivities 2016e DPM Hedged Commodity Sensitivities Commodity Q2-Q4 Full Year Price Price 2016 2016 Assumption Change (MM) (MM) NGLs (/Gal) 0.42 +/- 0.01 1 1 Natural Gas (/Mmbtu) 2.50 +/- 0.10 2 1…
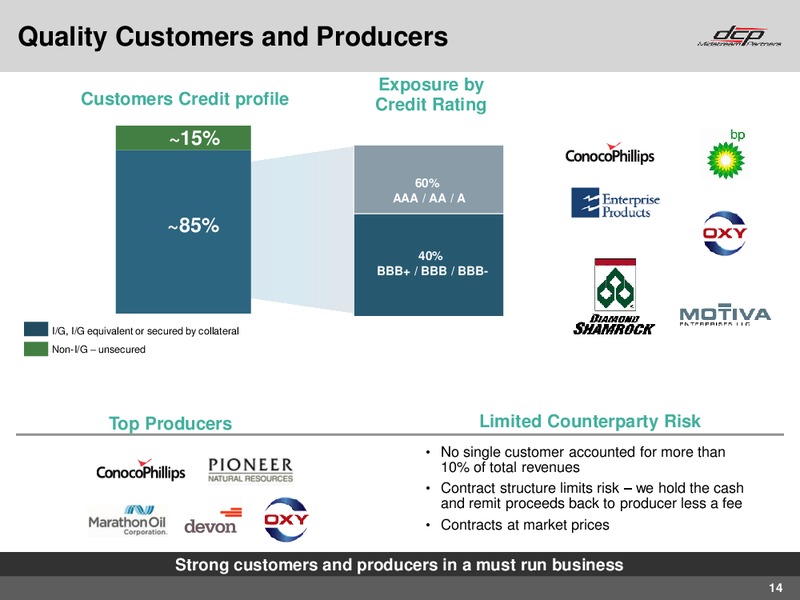
Quality Customers and Producers Exposure by Customers Credit profile Credit Rating 15% 60% AAA / AA / A 85% 40% BBB+ / BBB / BBB- I/G, I/G equivalent or secured by collateral Non-I/G unsecured Top Producers Limited…
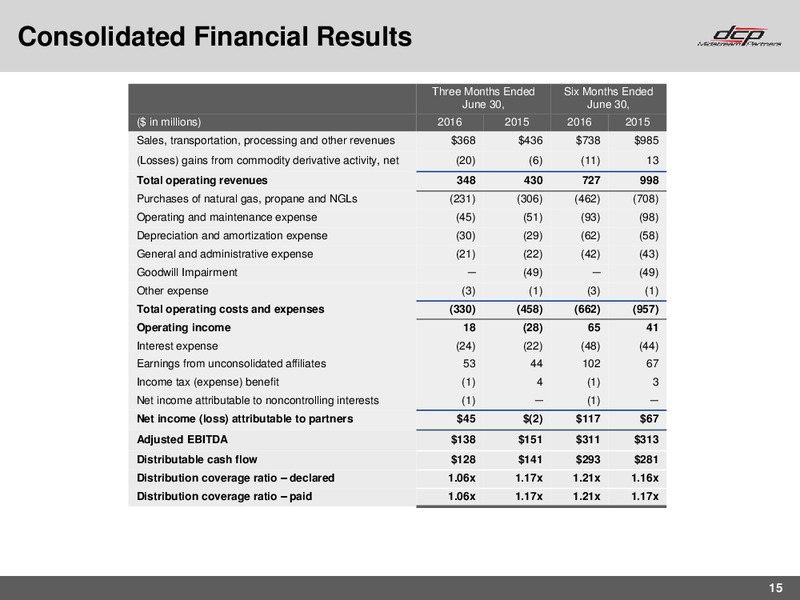
Consolidated Financial Results Three Months Ended Six Months Ended June 30, June 30, ( in millions) 2016 2015 2016 2015 Sales, transportation, processing and other revenues 368 436 738 985 (Losses) gains from commodity derivative…
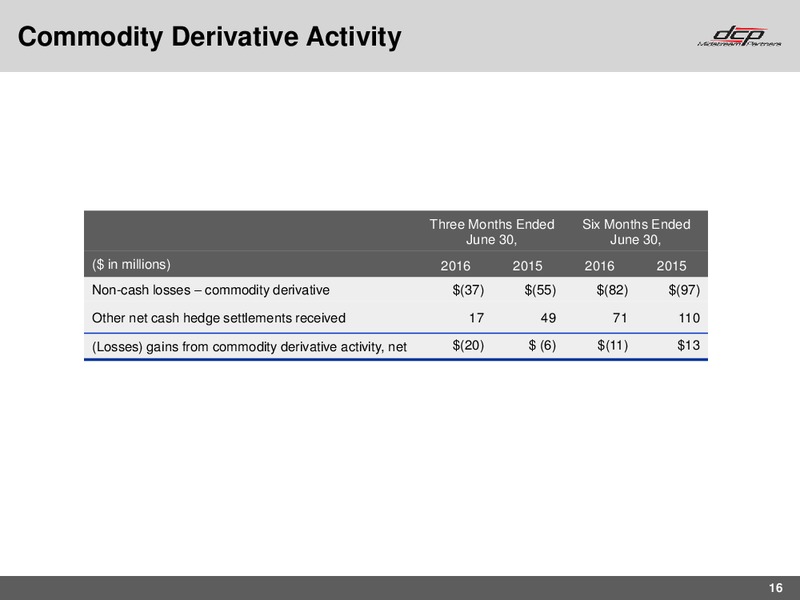
Commodity Derivative Activity Three Months Ended Six Months Ended June 30, June 30, ( in millions) 2016 2015 2016 2015 Non-cash losses commodity derivative (37) (55) (82) (97) Other net cash hedge settlements received 17 49 71…
 Loading...