Enable Midstream Partners, LP Second Quarter 2016 Conference Call August 3, 2016
Enable Midstream Highlights Second Quarter 2016 Results Enable is one of the top gathering and Q2-16 Q2-15 In millions, except per unit and ratio data processing companies in the country in terms of customer drilling activity, driven…
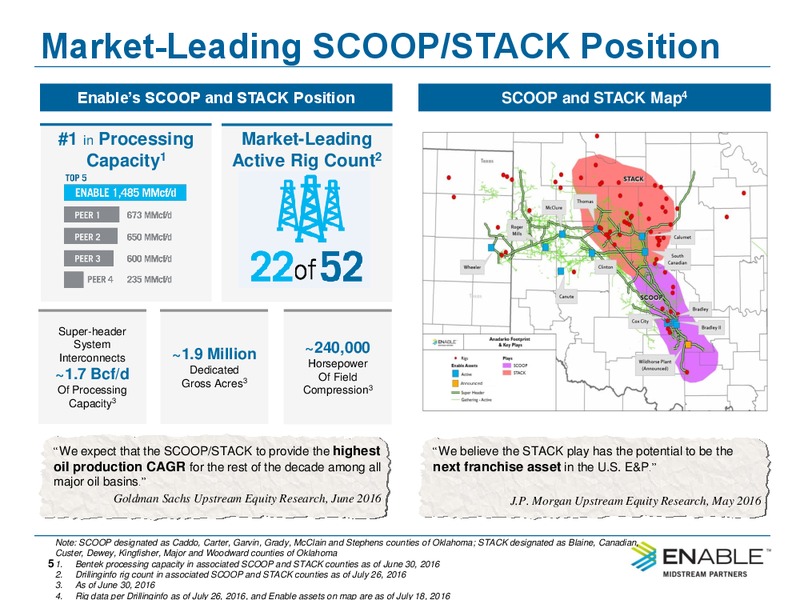
Market-Leading SCOOP/STACK Position Enables SCOOP and STACK Position SCOOP and STACK Map4 1 in Processing Market-Leading Capacity1 Active Rig Count2 Super-header System 240,000 Interconnects 1.9 Million Horsepower Dedicated…
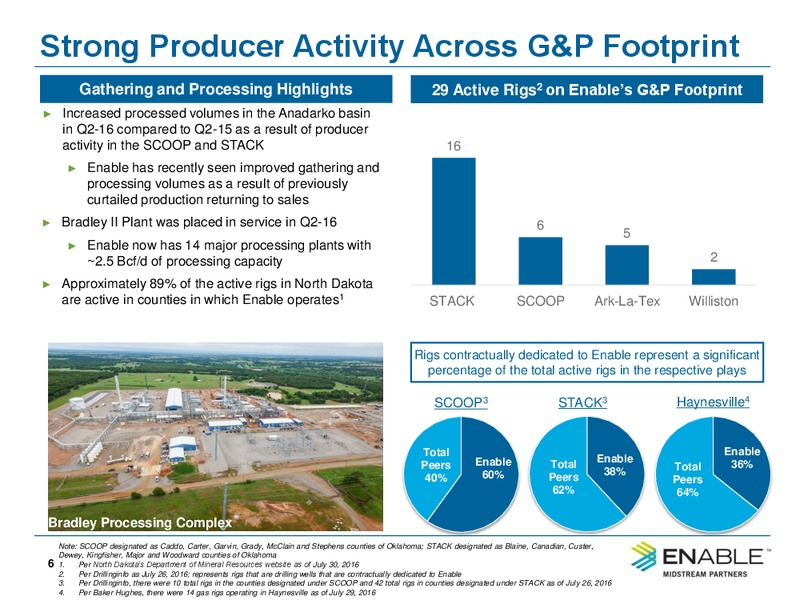
Strong Producer Activity Across G&P Footprint Gathering and Processing Highlights 29 Active Rigs2 on Enables G&P Footprint Increased processed volumes in the Anadarko basin in Q2-16 compared to Q2-15 as a result of producer activity…
Significant Fee-based Gross Margin from T&S Segment Highlights Transportation and Storage System System utilization demonstrates increased demand from power generation customers Interstate transportation volumes supporting power…
Operating Statistics Q2-2016 Q2-2015 Key Drivers: Q2-16 vs. Q2-15 Primarily lower Ark-La-Tex and Arkoma Gathered volumes (TBtu/d) 3.10 3.19 volumes Lower Ark-La-Tex and Arkoma volumes Natural gas processed volumes (TBtu/d) 1.76 1.84…
Financial Results Selected Results - in millions Q2-2016 Q2-2015 Key Drivers: Q2-16 vs. Q2-15 Revenue 529 590 Lower natural gas sales resulting from lower gathered volumes and lower commodity Gathering and Processing1 387 422 prices…
Financial Results Continued Selected Results - in millions Q2-2016 Q2-2015 Key Drivers: Q2-16 vs. Q2-15 Losses attributable to changes in fair value of commodity Net Income attributable to limited derivatives, lower commodity prices,…
Key Highlights Assets are located in prominent natural gas and crude oil producer basins with a market-leading midstream position in the SCOOP and STACK plays Strategically Located Significant drilling activity across gathering and…
Question and Answer Question & Answer 12
Appendix Appendix 13
Favorable Contract Structures and Credit Profile Commentary 2016 Fee-Based Gross Margin Profile1,3 Enables 2016 gross margin profile is expected 4% to be approximately 96% fee-based or hedged1 11% Certain gathering and processing…
2016 Financial, Operational and Capital Outlook Enable reaffirms its 2016 outlook, which is displayed below: in millions 2016 Financial and Operational Outlook Natural Gas Gathered Volumes (TBtu/d) 3.1 3.5 Natural Gas Processed…
Price Sensitivities Impact to 2016 Net Income1,2 % Change in Prices in millions +10% -10% Natural Gas and Ethane (6) 6 NGLs (excluding ethane) and Condensate (2) 2 Impact to 2016 Adjusted EBITDA2 % Change in Prices in millions +10%…
Non-GAAP Reconciliations Three Months Ended Six Months Ended June 30, June 30, 2016 2015 2016 2015 (In millions) Reconciliation of Gross margin to Revenues: Consolidated Revenues 529 590 1,038 1,206 Cost of natural gas and natural…
Non-GAAP Reconciliations Continued Three Months Ended Six Months Ended June 30, June 30, 2016 2015 2016 2015 1. Distributions from equity method affiliates (In millions, except distribution coverage ratio) includes a 7 million and 7…
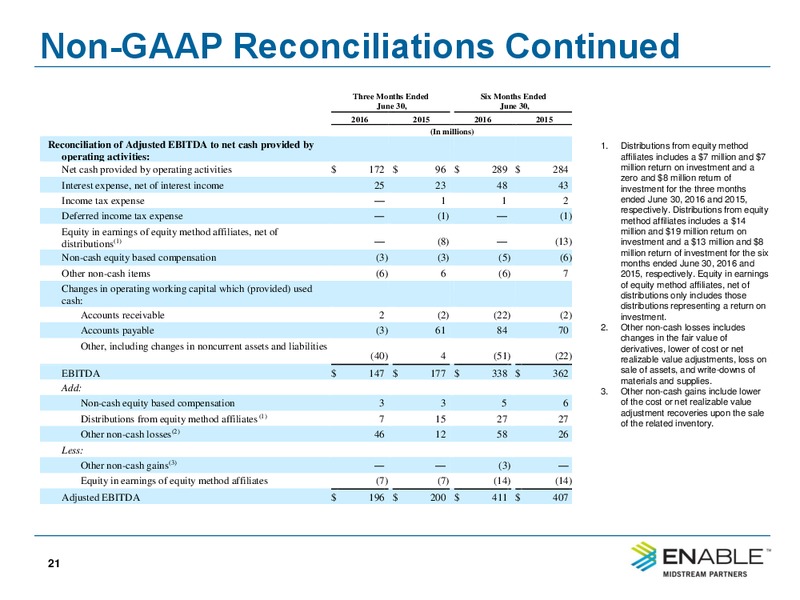
Non-GAAP Reconciliations Continued Three Months Ended Six Months Ended June 30, June 30, 2016 2015 2016 2015 (In millions) Reconciliation of Adjusted EBITDA to net cash provided by 1. Distributions from equity method operating…
Non-GAAP Reconciliations Continued Three Months Ended Six Months Ended June 30, June 30, 2016 2015 2016 2015 (In millions) Reconciliation of Adjusted interest expense to Interest expense: Interest Expense 25 23 48 43 Add:…
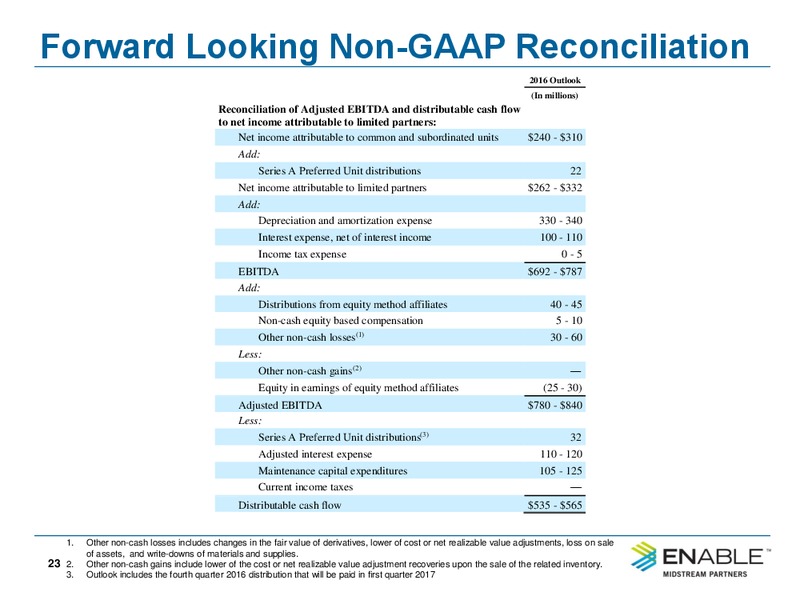
Forward Looking Non-GAAP Reconciliation 2016 Outlook (In millions) Reconciliation of Adjusted EBITDA and distributable cash flow to net income attributable to limited partners: Net income attributable to common and subordinated units…
Forward Looking Non-GAAP Reconciliation Continued 2016 Outlook (In millions) Reconciliation of Adjusted interest expense to Interest expense: Interest Expense 100 - 110 Add: Amortization of premium on long -term debt 6 Capitalized…
 Loading...