FY16 results & FY17 outlook Ian Davies, Managing Director and CEO Graham Yerbury, Chief Financial Officer 23 August 2016
Key takeaways FY16 results & FY17 outlook Strong financial position Demonstrated ability to high-grade capital spend and minimise operating spend Portfolio of growth projects progressing up the maturity curve Strongly…
Ian Davies Managing Director and CEO Highlights Financials Outlook Project updates Investment proposition 3 FY16 results & FY17 outlook
FY16 business highlights Strategic progress made in a challenging market Record safety performance, with a 71% improvement in TRIFR to 1.8 Strong defensive performance during the year, with a well timed hedging Corporate program,…
FY16 safety performance Record safety performance Safety performance 71% reduction in TRIFR reflects an improved 2 Exposure hours (millions) 8.4 8.6 safety culture 1.5 One lost time injury and recordable incident 6.5 6.2 42%…
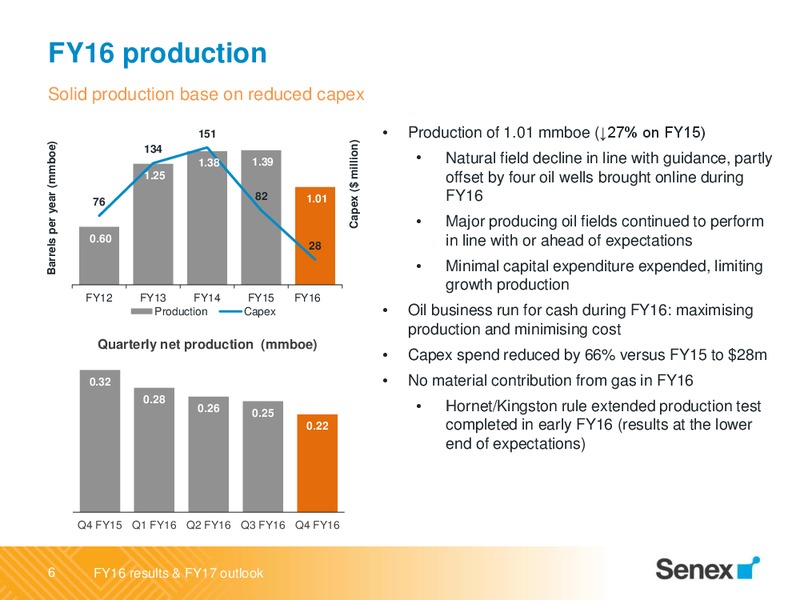
FY16 production Solid production base on reduced capex 151 Production of 1.01 mmboe (27% on FY15) Capex ( million) Barrels per year (mmboe) 134 1.38 1.39 Natural field decline in line with guidance, partly 1.25 offset by…
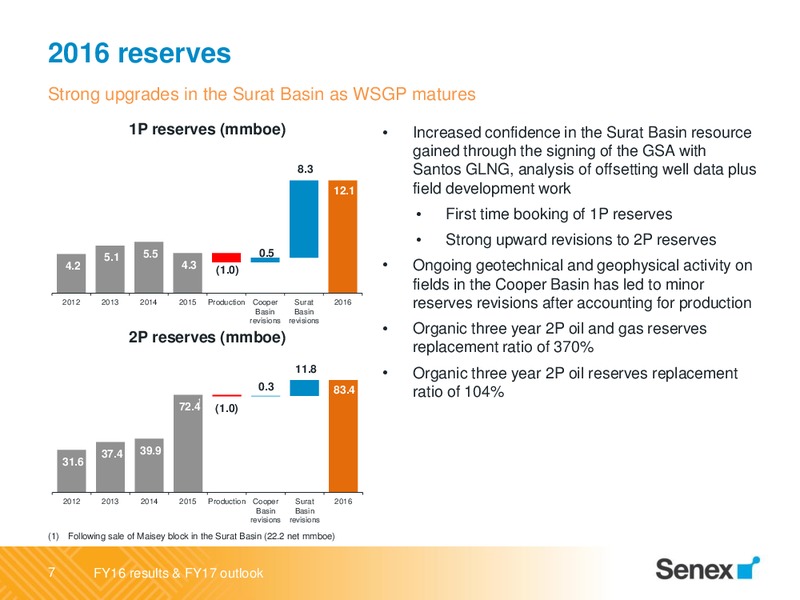
2016 reserves Strong upgrades in the Surat Basin as WSGP matures 1P reserves (mmboe) Increased confidence in the Surat Basin resource gained through the signing of the GSA with 8.3 Santos GLNG, analysis of offsetting well data plus…
Graham Yerbury Chief Financial Officer Highlights Financials Outlook Project updates Investment proposition 8 FY16 results & FY17 outlook
Key financial headlines Underlying net profit reflects offsetting impacts of price and cost FY16 FY15 Change Production (mmboe) 1.01 1.39 (27%) Sales volumes (mmboe) 0.97 1.32 (27%) Average realised oil price (A per barrel) 71 88 (19%)…
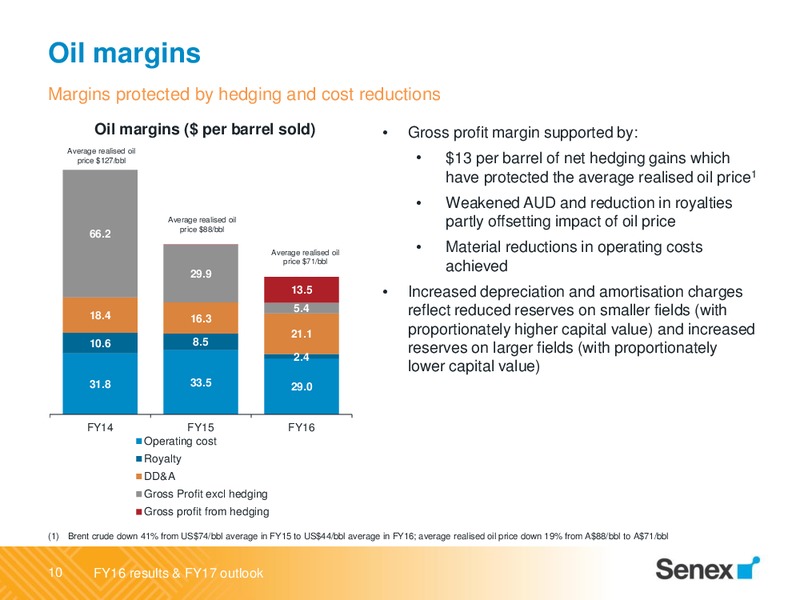
Oil margins Margins protected by hedging and cost reductions Oil margins ( per barrel sold) Gross profit margin supported by: Average realised oil price 127/bbl 13 per barrel of net hedging gains which have protected the average…
Underlying NPAT reconciliation Operational cost savings partly offset by lower oil price on lower volumes Movement in underlying net profit after tax ( million) 5.6 16.1 0.0 (1.2) 26.1 (30.8) (15.8) Underlying FY15 Sales…
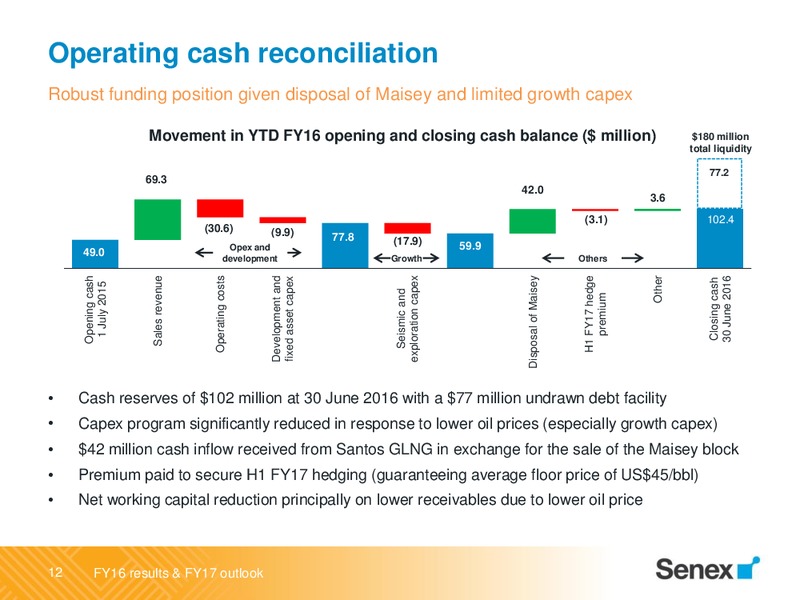
Operating cash reconciliation Robust funding position given disposal of Maisey and limited growth capex Movement in YTD FY16 opening and closing cash balance ( million) 180 million total liquidity 77.2 69.3 42.0 3.6 (3.1) 102.4…
Graham Yerbury Chief Financial Officer Highlights Financials Outlook Project updates Investment proposition 13 FY16 results & FY17 outlook
FY17 strategic priorities A foundation year for future growth Consolidate material business improvements made during the energy downturn Re-commence oil exploration and development program in the Cooper Basin with a focus on…
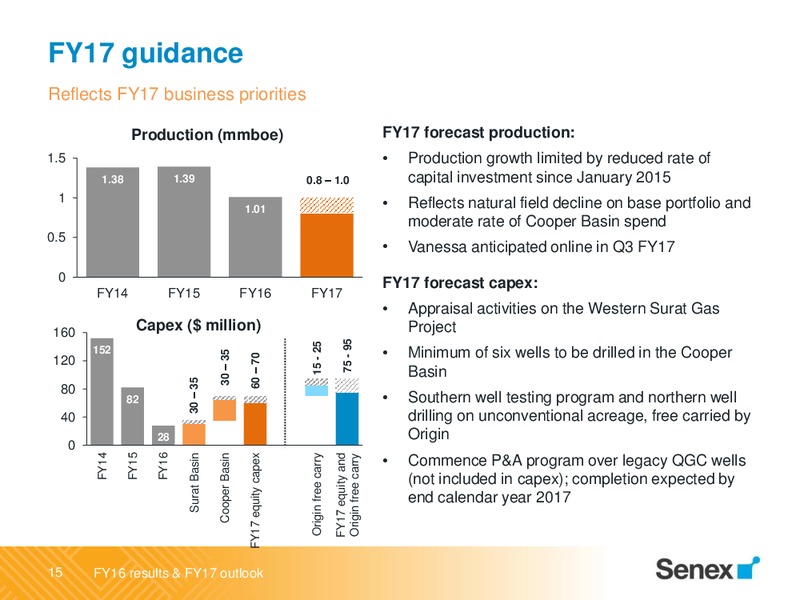
FY17 guidance Reflects FY17 business priorities Production (mmboe) FY17 forecast production: 1.5 Production growth limited by reduced rate of 1.38 1.39 0.8 1.0 capital investment since January 2015 1 Reflects natural field decline on…
Ian Davies Managing Director and CEO Highlights Financials Outlook Project updates Investment proposition 16 FY16 results & FY17 outlook
Cooper Basin oil program Focus on reserves replacement During FY16: Maximised cash flow from producing fields through focused cost reduction Progressed field development planning activities Embedded regional play-based exploration…
Cooper Basin gas program Focus on bringing gas to market During FY16: Unconventional gas project with Origin Energy: two-well drilling campaign completed in the Allunga Trough; first well location agreed in the Patchawarra Trough…
Western Surat Gas Project Focus on bringing wells online During FY16: Completed value accretive transactions with Santos GLNG providing funding and development pathway Analysis of offsetting well data and historic appraisal data…
Ian Davies Managing Director and CEO Highlights Financials Outlook Project updates Investment proposition 20 FY16 results & FY17 outlook
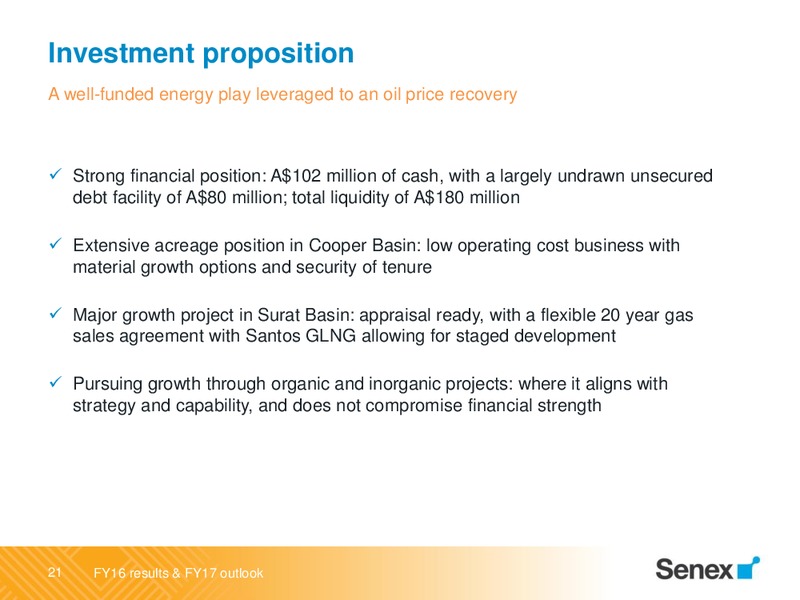
Investment proposition A well-funded energy play leveraged to an oil price recovery Strong financial position: A102 million of cash, with a largely undrawn unsecured debt facility of A80 million; total liquidity of A180 million…
Registered Office Investor enquiries: Tess Palmer Level 14, 144 Edward Street Investor Relations Manager GPO Box 2233 Phone: (07) 3335 9719 Brisbane, Queensland 4000 Australia Media enquiries: Karen Cottier Corporate Communications…
Appendix 1 Reserves and resources Revisions to % change 30 June 2015 Maisey sale Production previous 30 June 2016 yoy estimates Reserves 1P 4.3 - (1.0) 8.8 12.1 181% 2P 94.6 (22.2) (1.0) 12.1 83.4 (12%) 2C 340.7 - - (132.7)…
Appendix 2 Net profit after tax million FY16 FY15 FY16 NPAT driven by: Revenue 69.3 115.9 Gain on sale of the Maisey block Operating costs (30.6) (55.9) Lower impairment charges (all incurred in H1) Gain on sale of Maisey block 38.2…
Appendix 3 EBITDAX EBITDAX reconciliation FY16 FY15 million Statutory net profit (loss) after tax (33.2) (80.6) Add/(less): 1 Net interest 1.2 0.7 Tax - (10.7) Amortisation & depreciation 23.6 24.7 Impairment 69.7 97.0 EBITDA…
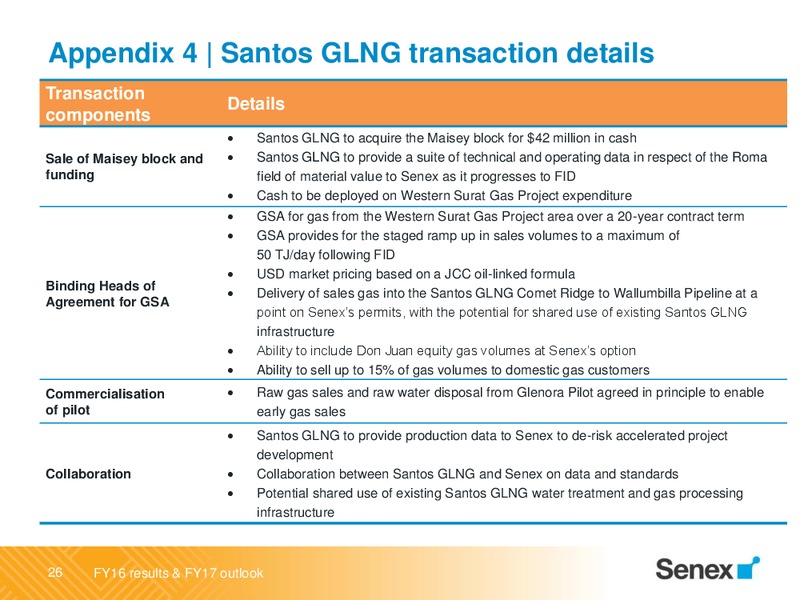
Appendix 4 Santos GLNG transaction details Transaction Details components Santos GLNG to acquire the Maisey block for 42 million in cash Sale of Maisey block and Santos GLNG to provide a suite of technical and operating data in respect…
 Loading...