AWE LIMITED FY16 FULL YEAR RESULTS PRESENTATION 25 August 2016
Overview DAVID BIGGS Managing Director and CEO 4
Agenda Overview Financial and Operating Results Strategic Focus Project Updates Outlook 5
Highlights Operational Solid production and HSE performance Refreshed and refocused management team Excellent Waitsia flow test results; subsequent reserves upgrade (3 June 2016) Waitsia stage 1A achieves first gas on time and budget…
Key objectives achieved Waitsia gas project Strengthened financial position Outstanding flow test results from Waitsia-1 Stronger balance sheet with net cash at 30 exceeded 50 mmscf/d from combined zones June 2016 FID for Stage 1A…
Management team refreshed David Biggs, Managing Ian Bucknell, Chief Neville Kelly, Company Director and CEO Financial Officer Secretary and GM Commenced in May 2016 Commenced in July 2016 Corporate Services Commenced in July…
Focused on core assets Focused on Australia, New Zealand and Indonesia; exited China and USA 9
Health, Safety, Environment & Community No Lost Time Injuries recorded in FY16 - 432 days injury free to 15 August 2016 No reportable environmental incidents in FY16 - 4th consecutive year of no reportable environmental incidents…
Financial and Operating Performance IAN BUCKNELL Chief Financial Officer 11
Full year financial performance Unit FY16 FY15 Change Total Production for FY16 mmboe 5.0 5.1 - 1% Sales Revenue1 m 202.4 283.7 -29% Operating costs m 110.4 140.5 -21% Field EBITDAX m 92.0 143.2 -36% Asset impairments before…
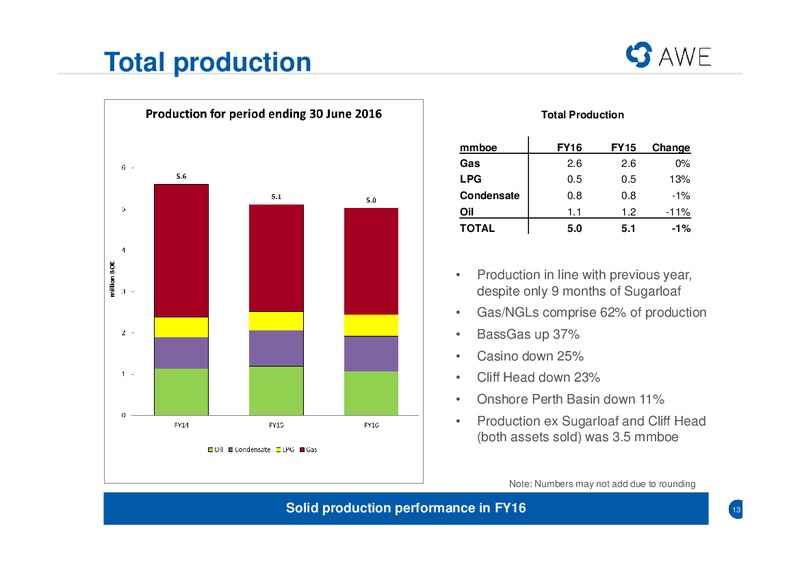
Total production Total Production mmboe FY16 FY15 Change Gas 2.6 2.6 0% LPG 0.5 0.5 13% Condensate 0.8 0.8 -1% Oil 1.1 1.2 -11% TOTAL 5.0 5.1 -1% Production in line with previous year, despite only 9 months of Sugarloaf…
Sales revenue Sales Revenue million FY16 FY15 Change Gas 69.4 78.1 -12% LPG 16.5 19.2 -14% Condensate 57.1 74.3 -23% Oil 59.3 112.1 -47% TOTAL 202.4 283.6 -29% Sales revenue down due to Sugarloaf sale and lower oil prices…
Field EBITDAX New Zealand and Western Australia impacted by lower oil prices 15
Non-cash impairments for FY16 Non-cash impairment Taxation Non-cash OIL AND GAS ASSETS before tax (m) Benefit impairment 1H 2H FY (m) after tax (m) Cliff Head Oil Project 14.6 - 14.6 - 14.6 Tui Area Oil Project 53.6 - 53.6 - 53.6…
Earnings analysis Net loss of 363.0m includes 291.8m in pre tax, non-cash impairments 17
Underlying NPAT reconciliation Reconciliation of underlying NPAT for FY16 m Statutory NPAT (363.0) Less non-recurring items (after tax): Impairment 242.5 Restructuring costs 5.8 Perth basin restoration costs 6.2 Fair value adjustment on…
Cash flow analysis Cash maintained and substantial debt reduction 19
Divestments Production and Development assets Sale Sugarloaf US190m - 10% working interest in USA unconventional oil project - Eliminated significant recurring capex - Substantially strengthened balance sheet Sale Cliff Head 3.2m -…
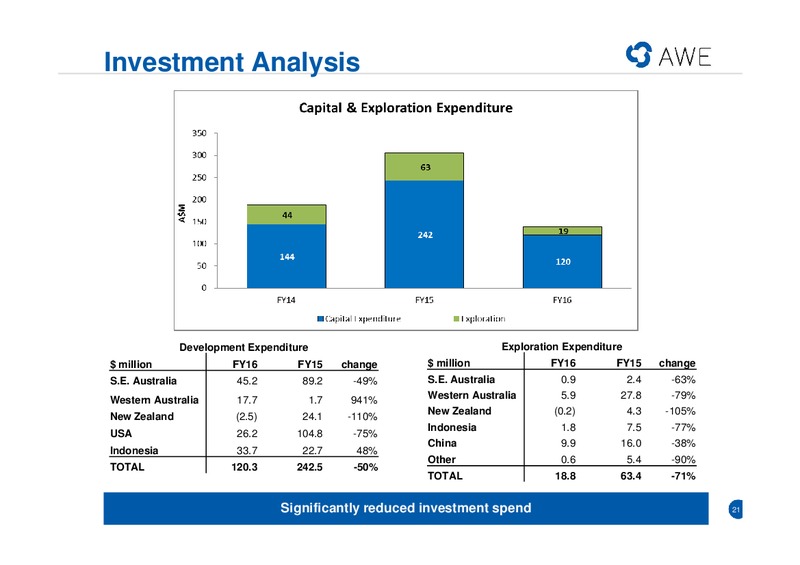
Investment Analysis Development Expenditure Exploration Expenditure million FY16 FY15 change million FY16 FY15 change S.E. Australia 45.2 89.2 -49% S.E. Australia 0.9 2.4 -63% Western Australia 17.7 1.7 941% Western Australia 5.9…
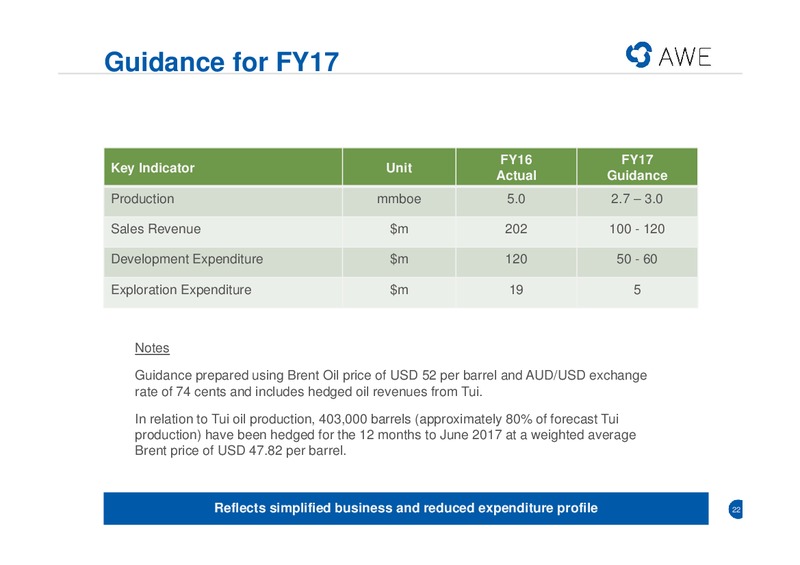
Guidance for FY17 FY16 FY17 Key Indicator Unit Actual Guidance Production mmboe 5.0 2.7 3.0 Sales Revenue m 202 100 - 120 Development Expenditure m 120 50 - 60 Exploration Expenditure m 19 5 Notes Guidance prepared using…
Strategic Focus DAVID BIGGS Managing Director and CEO 23
AWE reshaped to grow Near-term focus on Australian gas assets Production now 60% gas and NGLs; oil exposure hedged Deliver production and revenue growth through Waitsia gas project Continue appraisal and maximise exploration potential…
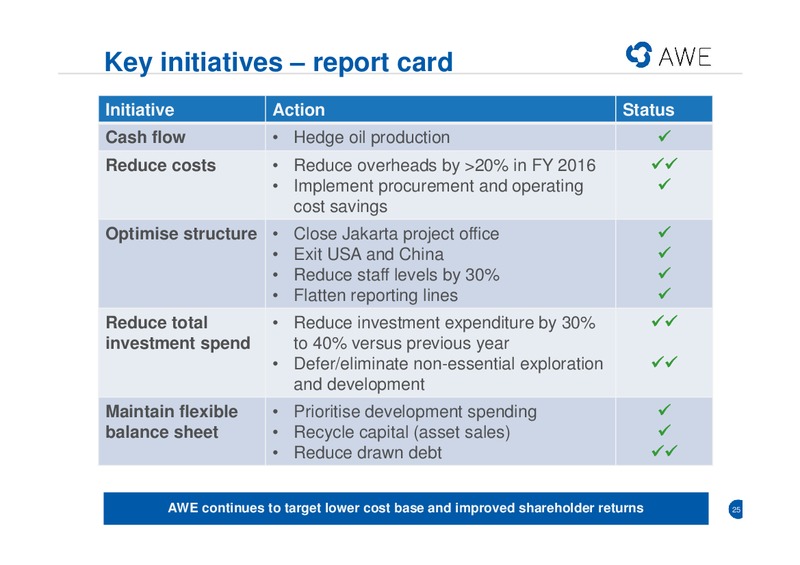
Key initiatives report card Initiative Action Status Cash flow Hedge oil production Reduce costs Reduce overheads by 20% in FY 2016 Implement procurement and operating cost savings Optimise structure Close Jakarta project office…
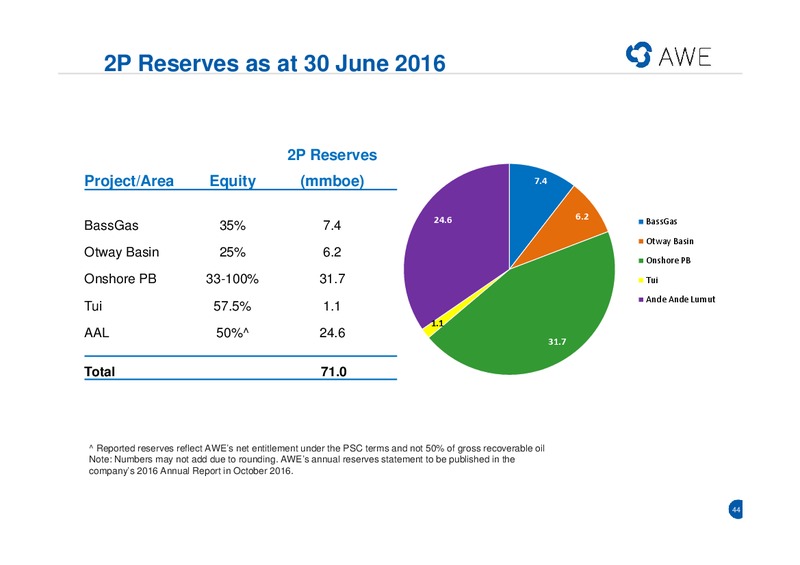
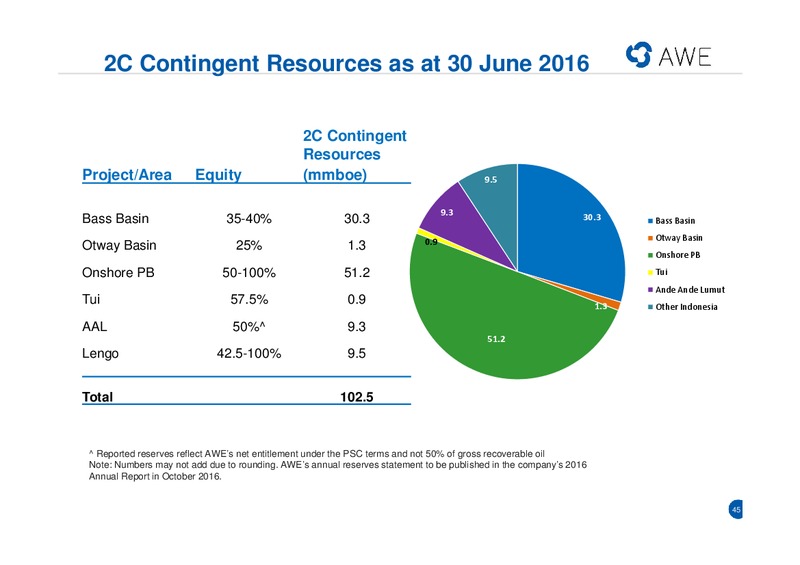
Reserves & Resources at 30 June 2016 2P Reserves plus 2C Resources totalled 173.5 mmboe at 30 June 2016 26
Clear development pipeline Near term - next 12 months First gas produced from Waitsia gas field (Stage 1A) Further appraisal drilling on Waitsia field (2 wells planned in 2017) Compression commissioned at BassGas delivering increased…
Capturing value in uncontracted gas Indicative only for Waitsia Stage 2 based on current company modelling. Not a formal company forecast Waitsia Stage 2 first gas to align with gas market demand opportunities 28
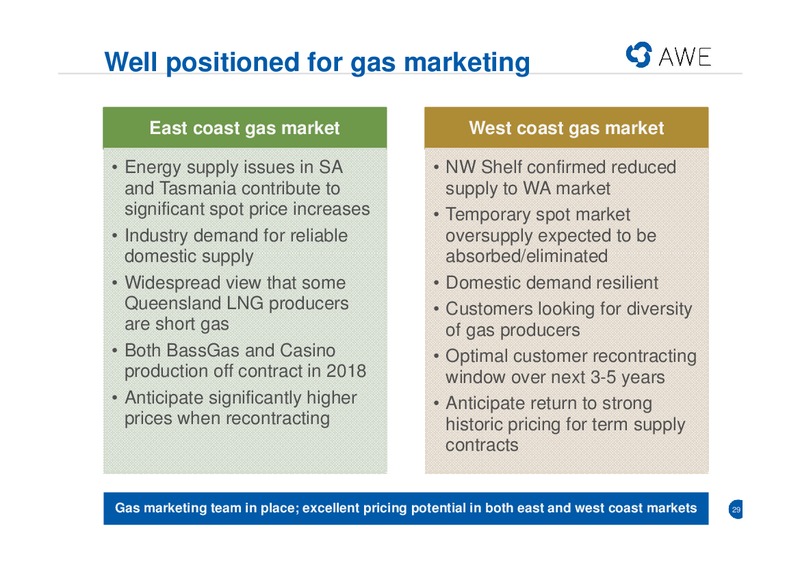
Well positioned for gas marketing East coast gas market West coast gas market Energy supply issues in SA NW Shelf confirmed reduced and Tasmania contribute to supply to WA market significant spot price increases Temporary spot…
Project Updates DAVID BIGGS Managing Director and CEO 30
Waitsia first gas on time and budget UPDATE PICS First gas achieved in August 2016; concept select process for Stage 2 (100 TJ/d) under way 31
BassGas MLE-3 making good progress Final phase of MLE project, hook-up of compression, forecast for completion in 2H FY17 32
AAL appraisal drilling completed on budget Preliminary testing indicates better crude quality, has potential to improve project economics 33
Outlook DAVID BIGGS Managing Director and CEO 34
Key near-term milestones Waitsia Gas Project enters next phase 10 TJ/d production from Waitsia Stage 1A from end of August 2016 Independent reserves review under way; results before end CY 2016 Appraisal drilling (2 wells) planned for…
Summary Stronger balance sheet with low debt levels Waitsia first gas achieved in August 2016; concept select process for Stage 2 (100 TJ/d) under way Better quality crude from AAL G-Sand appraisal well has potential to improve…
Appendix FY 2016 Full Year Results 38
Production analysis FY 2016 FY16 Percentage FY15 Percentage REGION AND ASSETS Production of total Production of total Australia 000 BOE 000 BOE Bass Basin (BassGas) 1,497 30% 1,093 22% Otway Basin (Casino) 805 16% 1,072 21% Perth…
Full year earnings breakdown FY16 FY15 m m Revenue 202.4 283.7 Operating Costs (110.4) (140.5) Amortisation (96.6) (119.1) Exploration costs expensed (18.2) (37.6) Asset impairments (291.8) (246.3) Net other (11.7) (49.7) (Loss)…
Full year segmental reporting Total New Zealand South-Eastern Western United States Indonesia Exploration millions Australia Australia 2016 2015 2016 2015 2016 2015 2016 2015 2016 2015 2016 2015 2016 2015 Sales revenue 202.3…
Full year cash flow analysis FY16 FY15 m m Opening cash 46.6 42.1 Net cash flow from operations 70.3 62.2 Asset acquisitions - (12.2) Asset disposals 235.6 56.3 Development spending (162.4) (241.5) Exploration spending initially…
Balance Sheet summary Jun 2016 Jun 2015 Balance sheet item m m Assets Cash and cash equivalents 32.6 46.6 Receivables and inventory 140.3 177.1 Exploration and evaluation assets 33.0 69.1 Oil and gas assets 375.7 882.9 Land and building…
Conversion Tables Volume 1 cubic metre = 1 kilolitre = 35.3 cubic feet = 6.29 barrels 1 megalitre = 1,000 cubic metres Energy Value 1,000 standard cubic feet of sales gas yields about 1.055 gigajoules (GJ) of heat 1 petajoule…
 Loading...