NextEra Energy Partners, LP August 2016 Investor Presentation
Table of Contents NextEra Energy Partners (NYSE:NEP) Slide 4 Organization and Structure Slide 8 Overview of Sponsor Slide 9 Drivers of Renewables Slide 14 Financial Review Slide 24 Appendix Slide 27 3
NextEra Energy Partners (NEP) is focused on investing in clean energy assets with stable cash flows NEP Overview NEP is a growth-oriented partnership formed by NextEra Energy, Inc. (NEE) to: Acquire contracted clean energy projects…
The NEP portfolio is diversified by geography and asset mix NEP Asset Portfolio(1,2) Wind assets: 17 projects 2,346 MW Solar assets: 4 projects 310 MW Pipeline assets: Seven natural gas pipelines 542 miles 3 Bcf of…
NEP has diversified its high-quality asset base while maintaining the long contract life, minimal commodity risk, and largely investment-grade counterparty mix of its portfolio NEP Portfolio Characteristics Counterparty Credit(1,2)…
Accretive acquisitions funded by access to both equity and debt have supported significant growth in cash available for distribution (CAFD) and LP distributions NEP Portfolio Additions Renewables Capacity(1) Pipeline Assets 2,656 MW 4…
NEP is a growth-oriented limited partnership with many structural attributes that create value for LP holders NEP Organizational Structure OpCo Ownership NEE Public investors own economic interest in 100% 71% OpCo through 100%…
Aligned interests with NextEra Energy IDR Fee Asset Sale Interest Proceeds Accretive Increase Drop- IDR Fee Downs Cash Flows Driving LP Unit Growth is the Key LP Distribution Growth Retained LP Stake 9
We believe the strength of NextEra Energy (NEE) makes it the premier YieldCo sponsor in the sector NextEra Energy: Partnership with NEP Characteristics of a premier sponsor: NEE Scale, financial strength and experience Strong…
NextEra Energy is comprised of two strong businesses supported by a common platform 59 B market capitalization(1) 45 GW in operation(2) 85 B in total assets Partnership with One of the largest electric The world leader in…
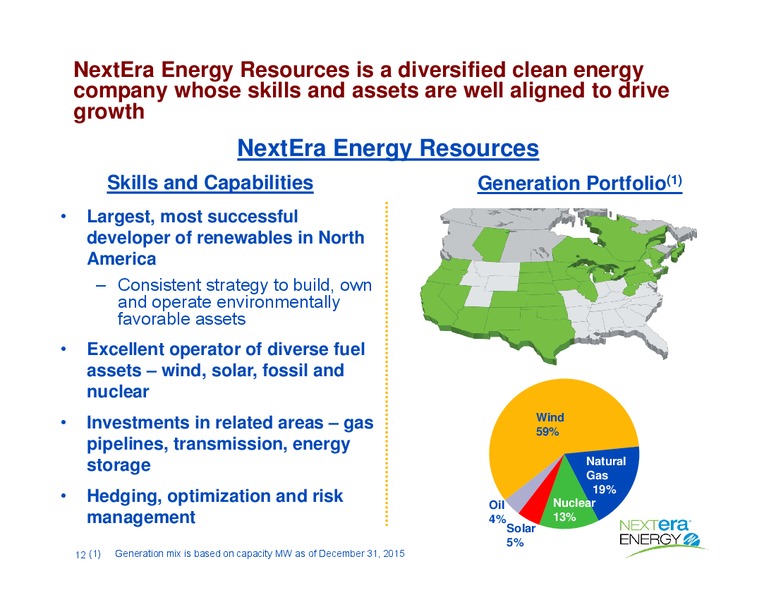
NextEra Energy Resources is a diversified clean energy company whose skills and assets are well aligned to drive growth NextEra Energy Resources Skills and Capabilities Generation Portfolio(1) Largest, most successful developer of…
Energy Resources growth is driven by its best-in-class development skills NextEra Energy Resources Development Skills Wind and Solar Portfolio(1) 18,000 Customer Wind Relationships Engineering/ Regulatory 12,000 Solar…
NEP believes that the opportunities for renewables have never been stronger Drivers for New Renewables Certainty of U.S. Federal Tax incentives for renewables Improvements in wind and solar technology and declining cost trends…
U.S. Federal tax incentives for completed renewables projects have been extended into the next decade Extended U.S Federal Tax Credits Wind Production Solar Investment Tax Credit (PTC) Tax Credit (ITC) Start of Start of Construction…
Turbine price reductions and efficiency improvements due to blade length and tower heights have reduced the average delivered cost of new wind Wind Technology Levelized Cost of Net Capacity Factor(1) Electricity from Wind(2) 60% 70…
Solar installation costs are declining and efficiency is improving Solar Technology PV Module Efficiency Levelized Cost of and Delivered Cost(1) Electricity from Solar(2) 19.0% Efficiency Cost 0.80 160 0.71 18.0% 0.62 0.65 120…
NEP distributable cash flow is driven by OpCo distributions Distribution Mechanics Public The operating subsidiaries Unitholders manage the project entities, service debt payments and fund any maintenance CapEx NextEra Energy…
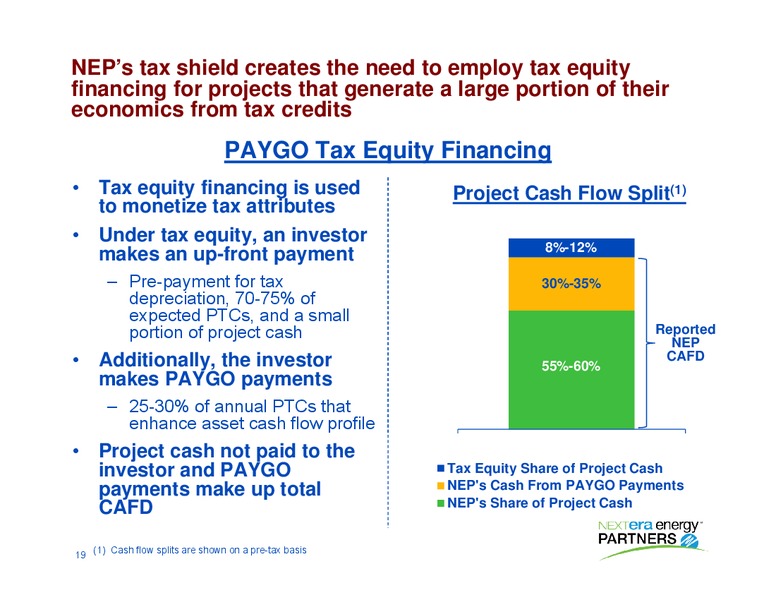
NEPs tax shield creates the need to employ tax equity financing for projects that generate a large portion of their economics from tax credits PAYGO Tax Equity Financing Tax equity financing is used Project Cash Flow Split(1) to…
As of the July 5, 2016 acquisition, NEP had 300 - 400 MM of remaining HoldCo debt capacity HoldCo Debt Capacity 1,075-1,175 775 MM 3.5x 21-31 310-340 300-400 10-20 37-41 230-260 Estimated Corporate IDR Fees(2) HoldCo Cash…
NEP continues to evaluate the optimal capital structure for distribution growth, which includes a combination of HoldCo debt and equity to fund an acquisition Optimizing Capital Structure NEP typically purchases assets financed with…
NEPs long-term capital structure target should be incorporated when evaluating asset-level returns Illustrative Asset Acquisition 100 MW wind asset Purchase HoldCo Residual Purchase price: Price Debt(1) Equity 100 MM, plus…
An acquisition's CAFD/unit then flows through the IDR tiers to determine how much of the cash will flow to LP unitholders in order to calculate their return Illustrative IDR Split 4.00-5.00 CAFD/Unit X 80% Payout Ratio =…
FINANCIAL REVIEW 24
After the acceleration of growth in 2015, our current expectations are for NEP to grow LP distributions by 12-15% annually through 2020 NEP LP Distributions Long-Term Growth Outlook(1) 2.17-2.47 2.50 2.00 1.50 1.38-1.41 1.23…
NextEra Energy Partners Adjusted EBITDA and CAFD Expectations(1,2) Adjusted EBITDA CAFD 12/31/16 Run Rate(3) 670 - 760 MM 230 - 290 MM Unit Distributions 2016 1.38 - 1.41 annualized rate by year end(4) 2016 - 2020 12% - 15%…
Appendix 27
Expected Cash Available for Distribution(1) (December 31, 2016 Run Rate CAFD) 750-840(2) (10-20) (40-60) 670-760 (240-260)(3) (155-205)(4) MM (25-30)(5) (3-8) 230-290(6) Project-level Corporate IDR Adjusted Debt Service…
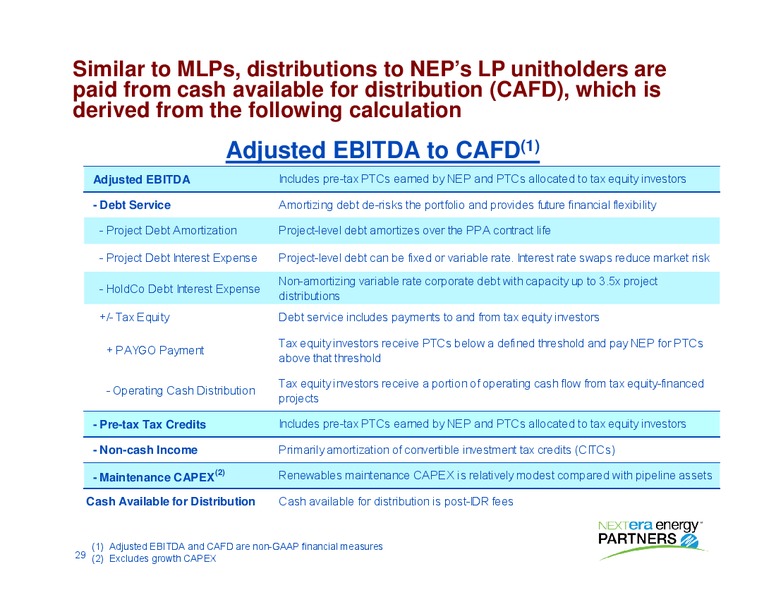
Similar to MLPs, distributions to NEPs LP unitholders are paid from cash available for distribution (CAFD), which is derived from the following calculation Adjusted EBITDA to CAFD(1) Adjusted EBITDA Includes pre-tax PTCs earned by NEP…
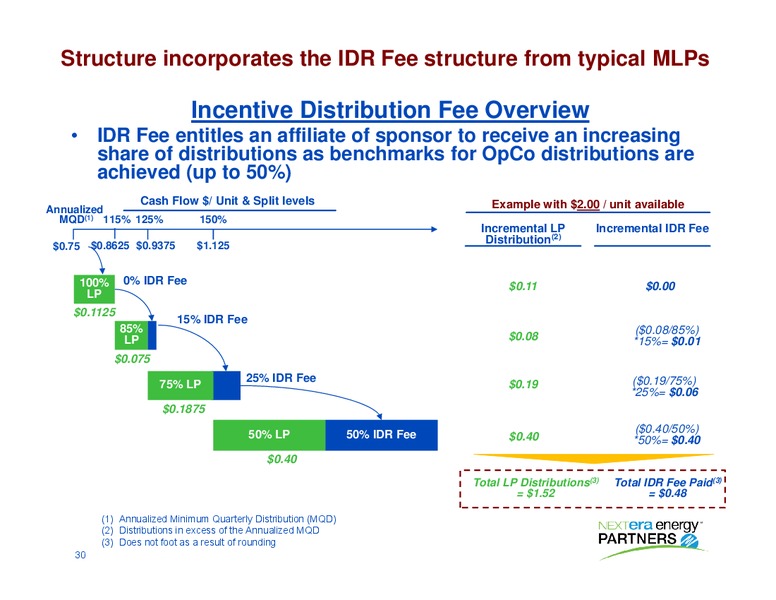
Structure incorporates the IDR Fee structure from typical MLPs Incentive Distribution Fee Overview IDR Fee entitles an affiliate of sponsor to receive an increasing share of distributions as benchmarks for OpCo distributions are…
 Loading...